Data Management
Data collections
There are a number of ways to view your data in ISPyB including:
- from the home page which shows your previous and next visits
- from the visits page which shows all visits for the currently selected proposal.
Click on a visit to see the data collections associated with it.
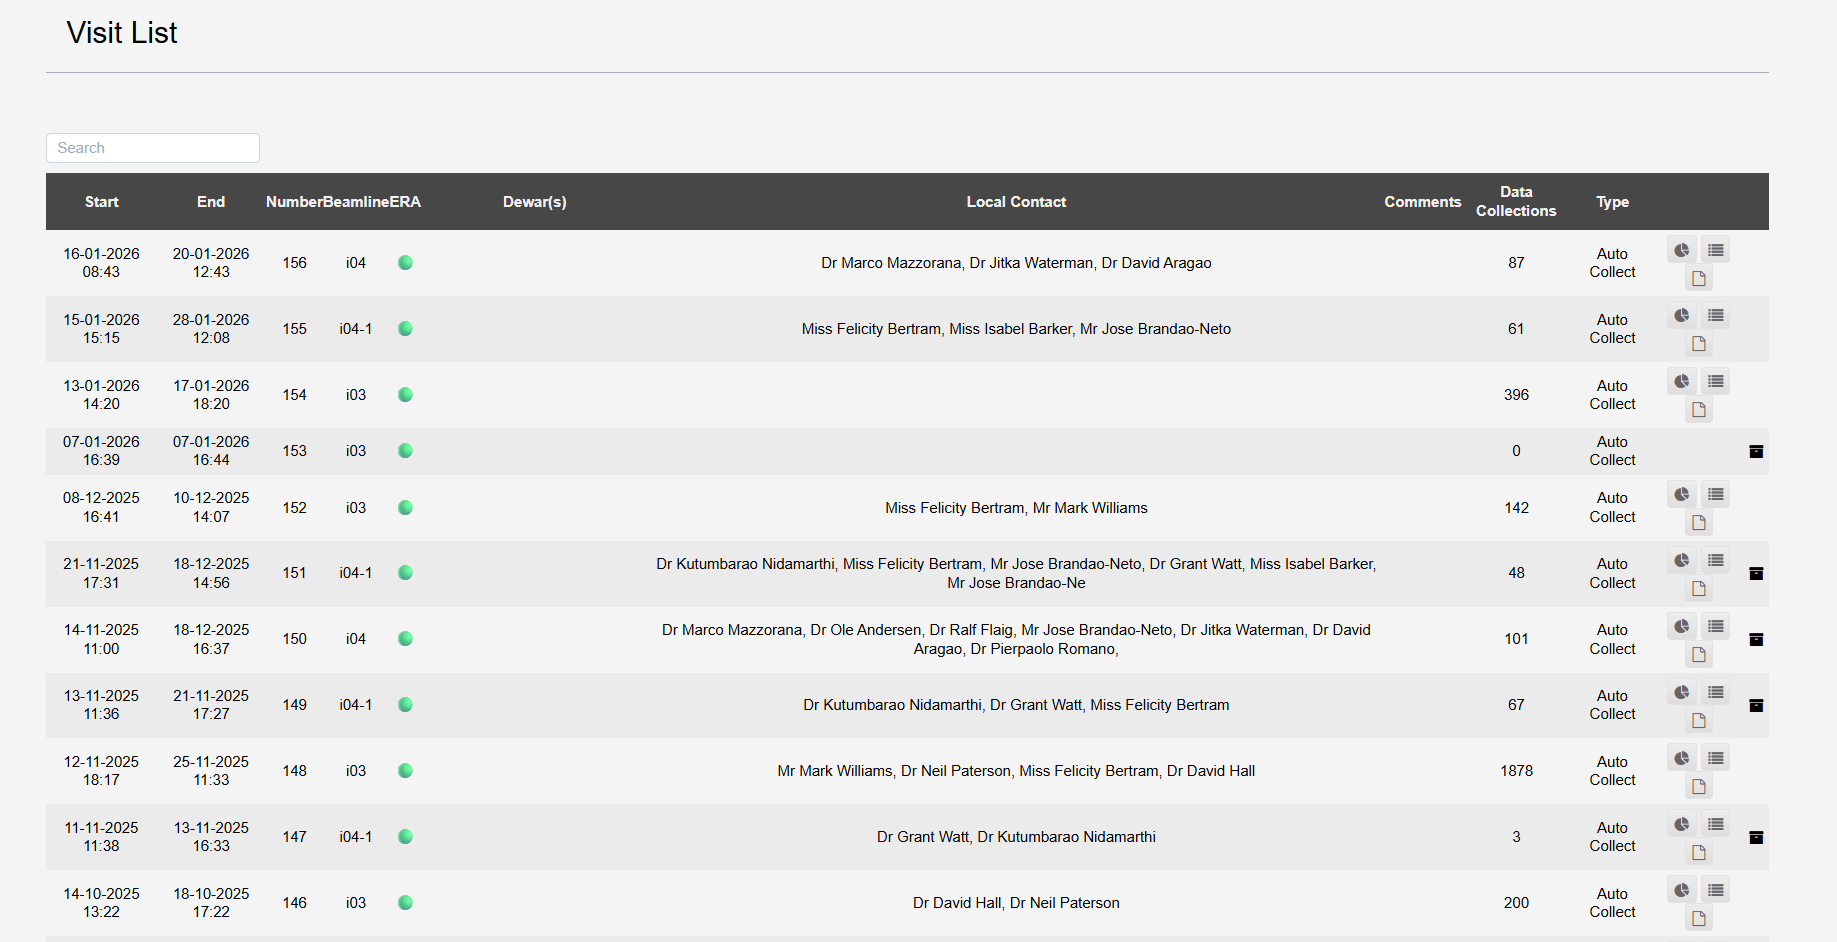
Viewing a visit in ISPyB/ Synchweb you will see a view similar to below. Click through to see how to manage your data.

