Toolbar in ISPyB
At the top of the main data view in ISPyB there are short-cut buttons to various useful functions:
![]()
- Assign Containers
- Summary
- Autoprocessing
- Visit Status
- Users
- Dewars
- Sample Changer
- Reprocessing
- Beamline Status
Summaries of all data from a visit can be obtained, which may be useful for comparing different crystals in the same project.
1. Assign Containers
Containers are assigned prior to beamtime to match the puck position in the robot dewar. For remote collections this is normally carried out by the local contact, but should be checked by the user.
2. Summary
The summary link shows each data collection in a visit:
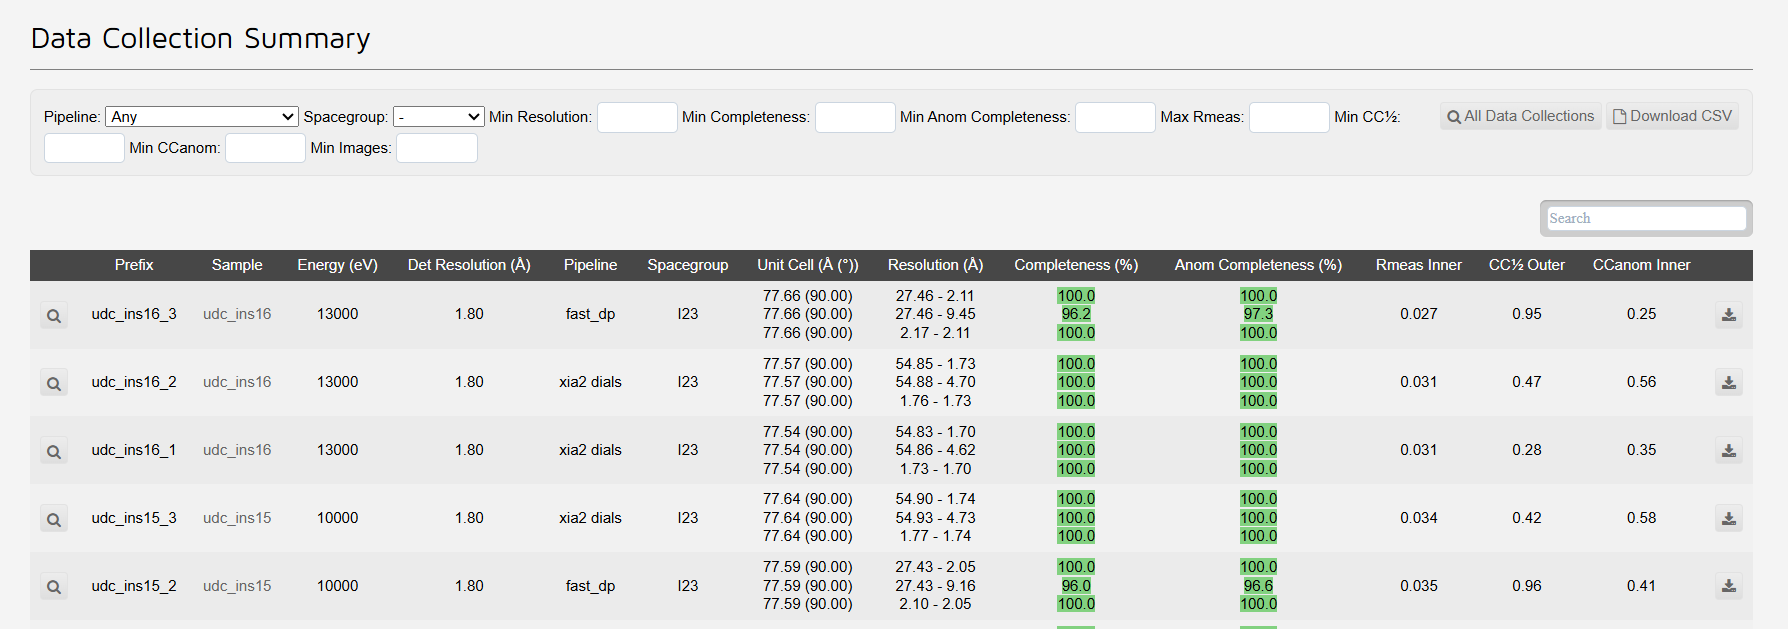
The table contains all data collections, each summarised with:
- Data collection prefix
- Sample name
- Energy
- Detector Resolution
- The "best" pipeline (which is displayed depends on how you are sorting the columns)
- Spacegroup
- Unit cell
- Resolution limits, and inner and outer shells
- Completeness and acomalous completeness for each shell
- Rmeas for the inner shell
- CC-half for the outer shell
- CC-anom for the inner shell
- A download link to mtz file [Currently not working]
Note that the data can be filtered using the boxes at the top, and sorted by clicking on the column headings. You can also download a CSV of the current layout you have displayed.
3. Autoprocessing
The autoprocessing summary shows which autoprocessing pieplines have run:
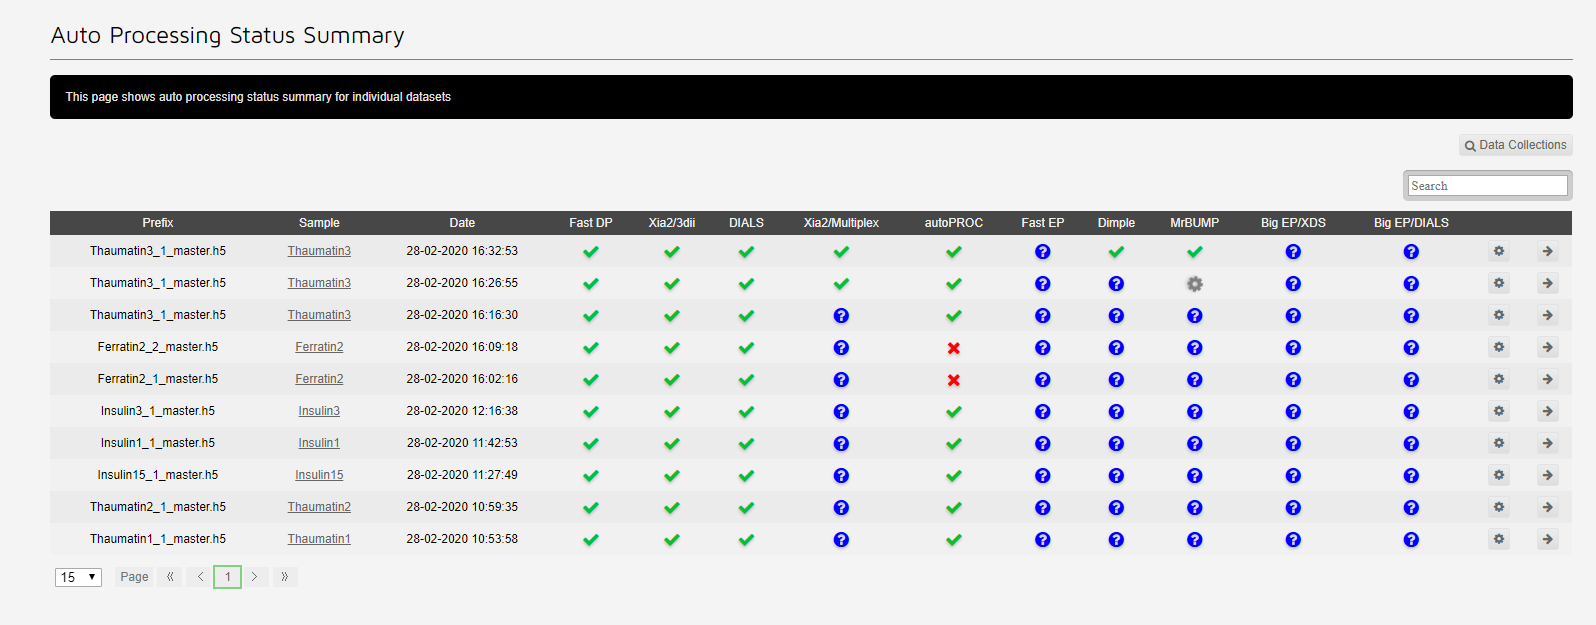
The cog allows reprocessing for the dataset. The arrow redirects to the dataset.
4. Visit Status
A quick link to the main summary of Visit Statistics which are discussed further here.
5. Users
Hover over the icon to see a list of people involved in the visit.
Users are added to proposals by the BAG PI, in UAS. You need to be added to a proposal to be able to access data from the visit, as well as those Users involved in data collection.
6. Dewars
Hover over the icon to see which Dewars are assigned to this visit.
7. Sample Changer
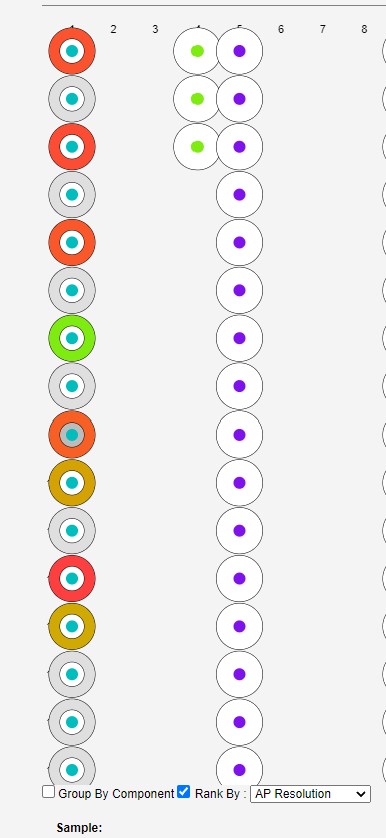
The sample changer status shows a representation of the pins available for your visit.
You can also reach a quick view of this on the side-bar of an active visit.
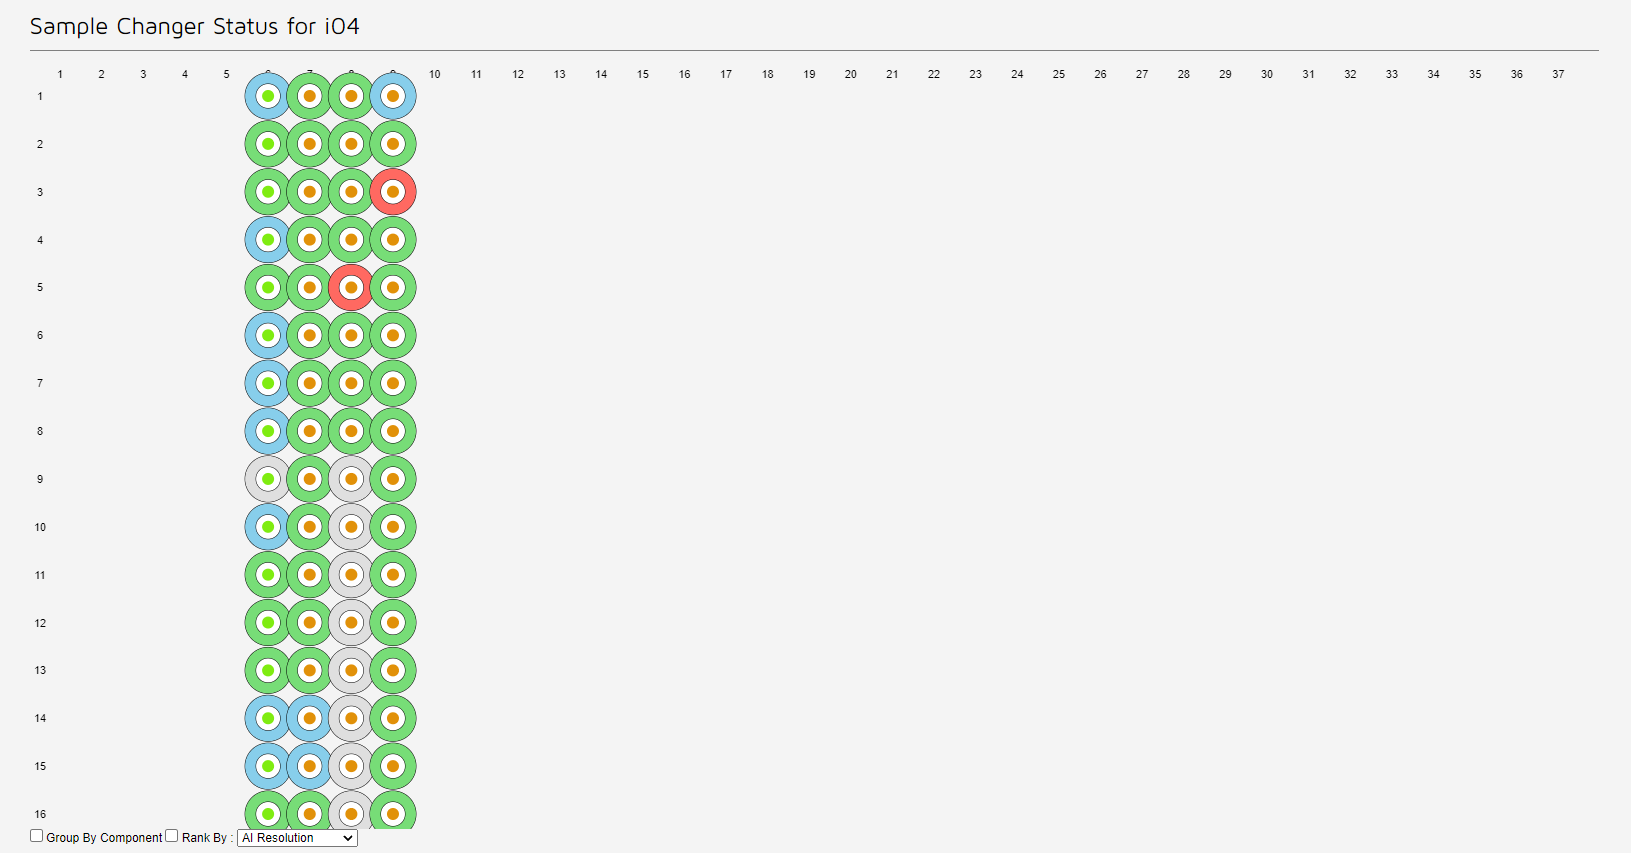
Each sample is represented by a circle, a ring of solid colour surrounding a central dot. In the default view
- A grey ring represents a sample that has not been loaded.
- A red dot represents a sample with grid scan or centring, but not data collection.
- An orange dot represents a sample that has been screened.
- A blue ring represents a sample that has not had autoprocessing.
- A green ring represents a sample with autoprocessing has been run.
- The change in colour the central dot represnts a different protein.
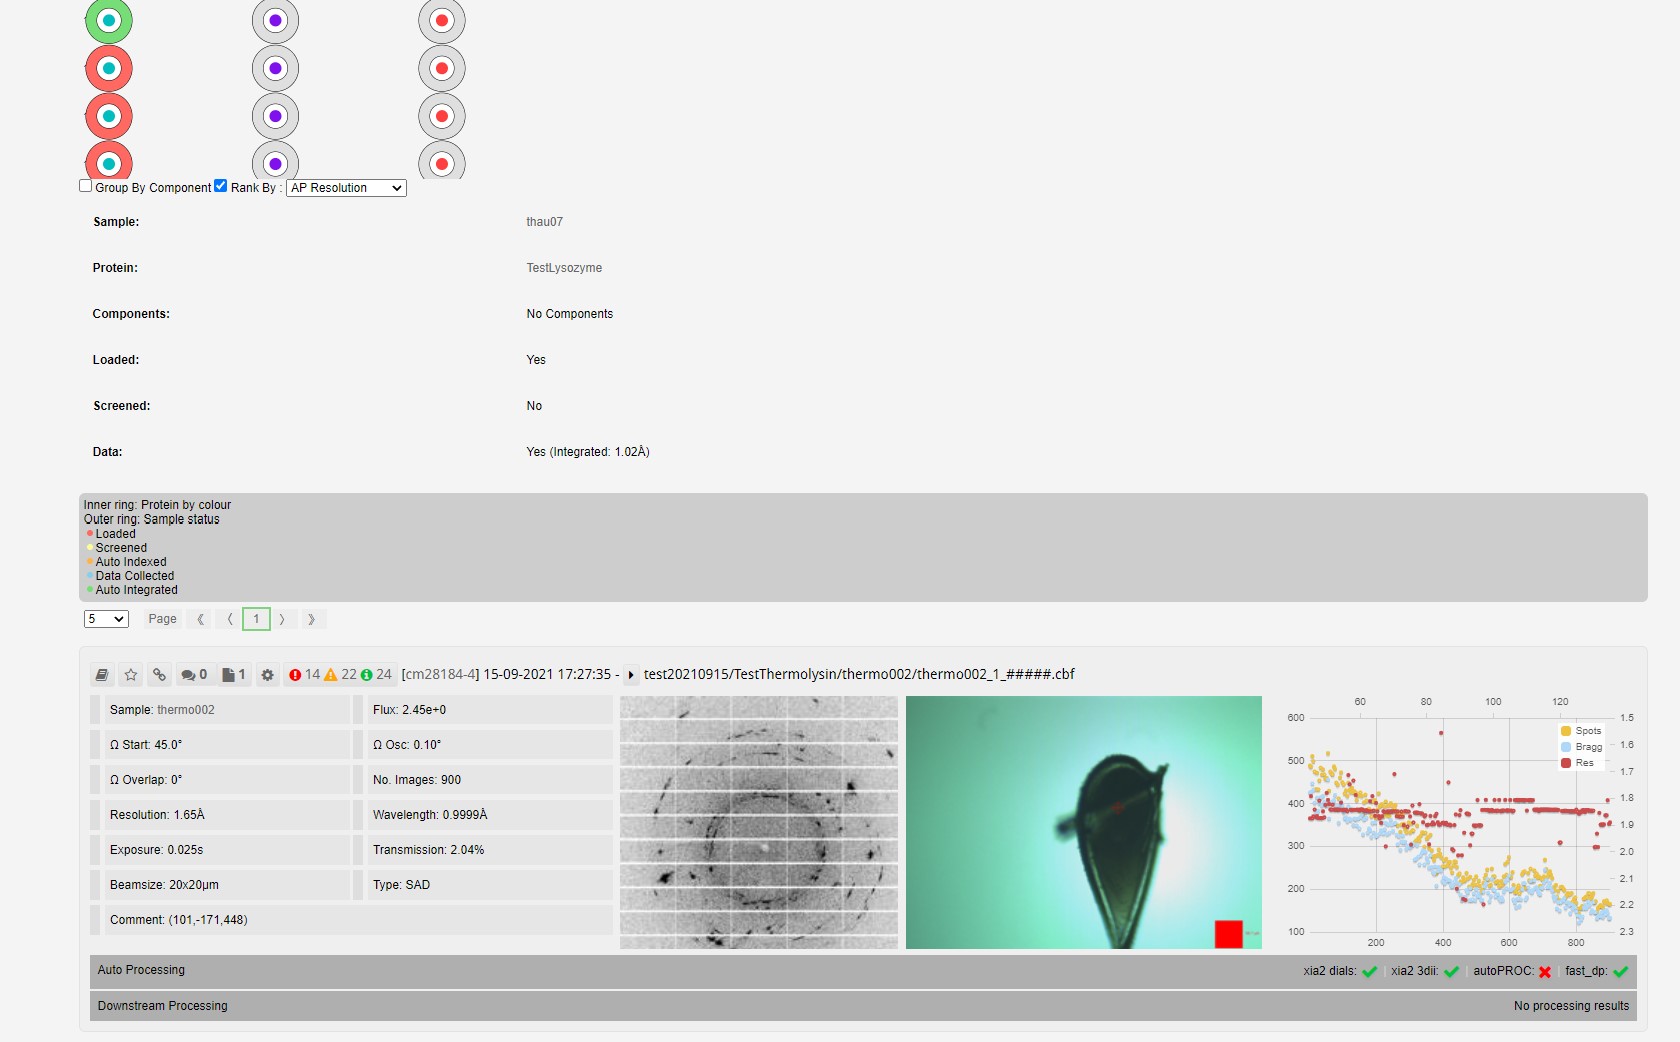
When hovering over a sample the remainder of those protien samples are highlighted:
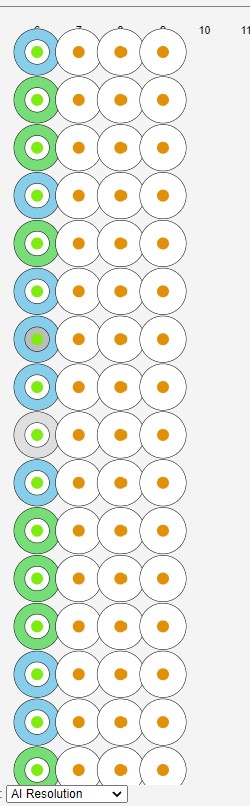
The proteins not highlighted are shown in white.
The filtering per can be used to rank by completeness or resolution, this alters the colours of the ring to the relative resolution or completenes compared to that of the best dataset for that protein. This can be useful on assessing whether any further datasets are required or recollections of exisiting samples need to be made.
If a circle is clicked the data colections and grid scans for that sample are shown below.
8. Reprocessing
A reprocessing panel appears to re-submit automatic processing pipelines with different parameters. See full details in reprocessing data.
9. Beamline Status
This brings you to a quick view which shows the beamline status for your visit, and the webcams.
As most MX visits to Diamond are done by remote access, you will not get the same notifications about beam dumps that you would get if you were a user on site, so it is a good idea to keep an eye on this status, or the machine status at https://machine-status.diamond.ac.uk.
