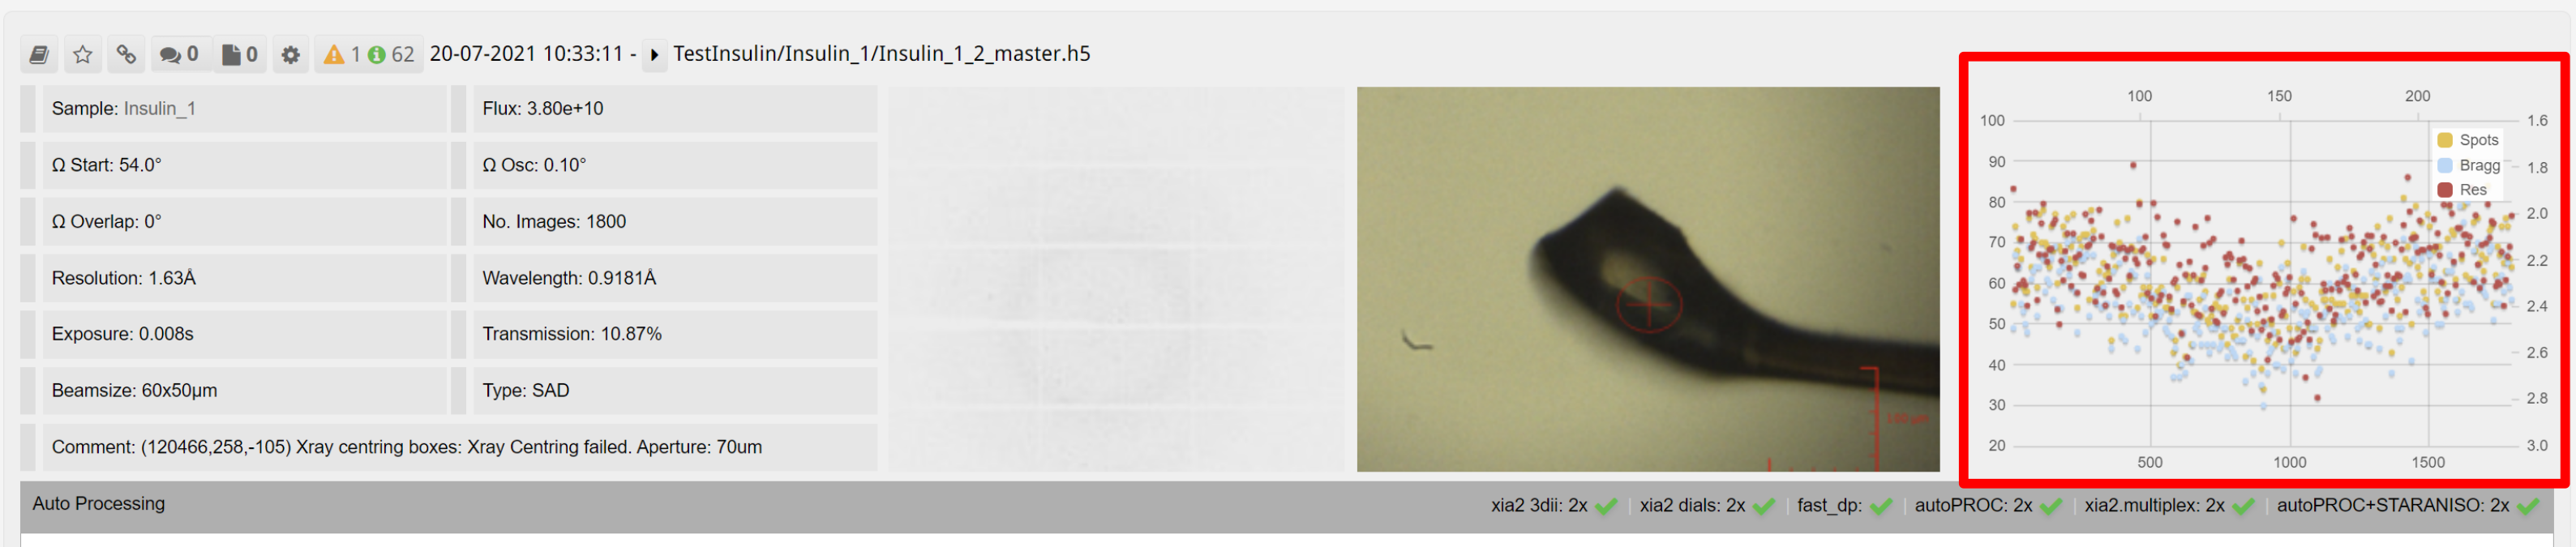
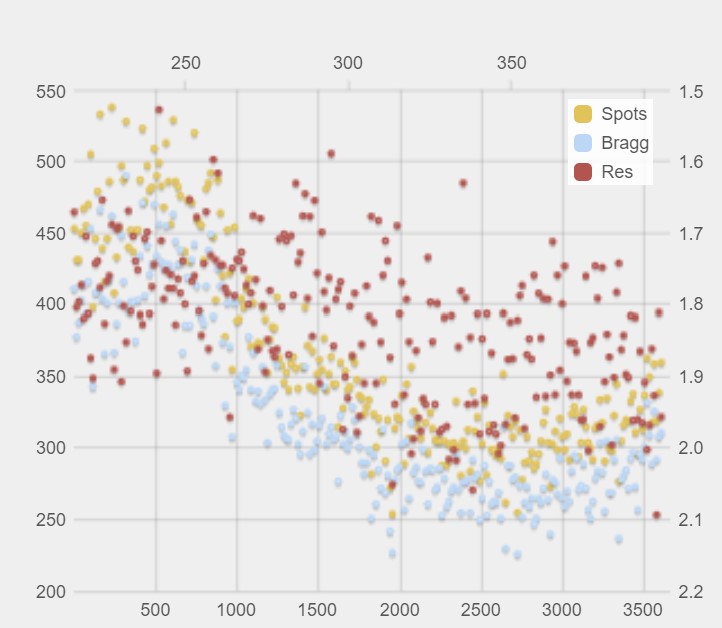
The per image analysis plot shows:
- Number of total spots found (yellow)
- Number of those spots which can identiifed as Bragg diffraction (blue)
- An estimate of resolution (red)
The spots are determined by the DIALS spot finding algorithm. Spots are defined as connected regions of at least three pixels which have intensities greater than three standard deviations above a local mean. Spots are classified as Bragg spots if their resolution is outside of known ice-ring resolution ranges. A full description of the spot finding algorithm can be found in the DIALS publication. The estimate of the resolution is determined by the limit at which statistically significant spots were found, based on a fit to the trend of spot intensity/sigma as a function of resolution.
The axes are:
- Lower x: Number of Images
- Upper x: Degrees (including the starting angle)
- Left y: Spots identified
- Right y: Resolution estimate
The plot can be clicked to open it in a modal window:
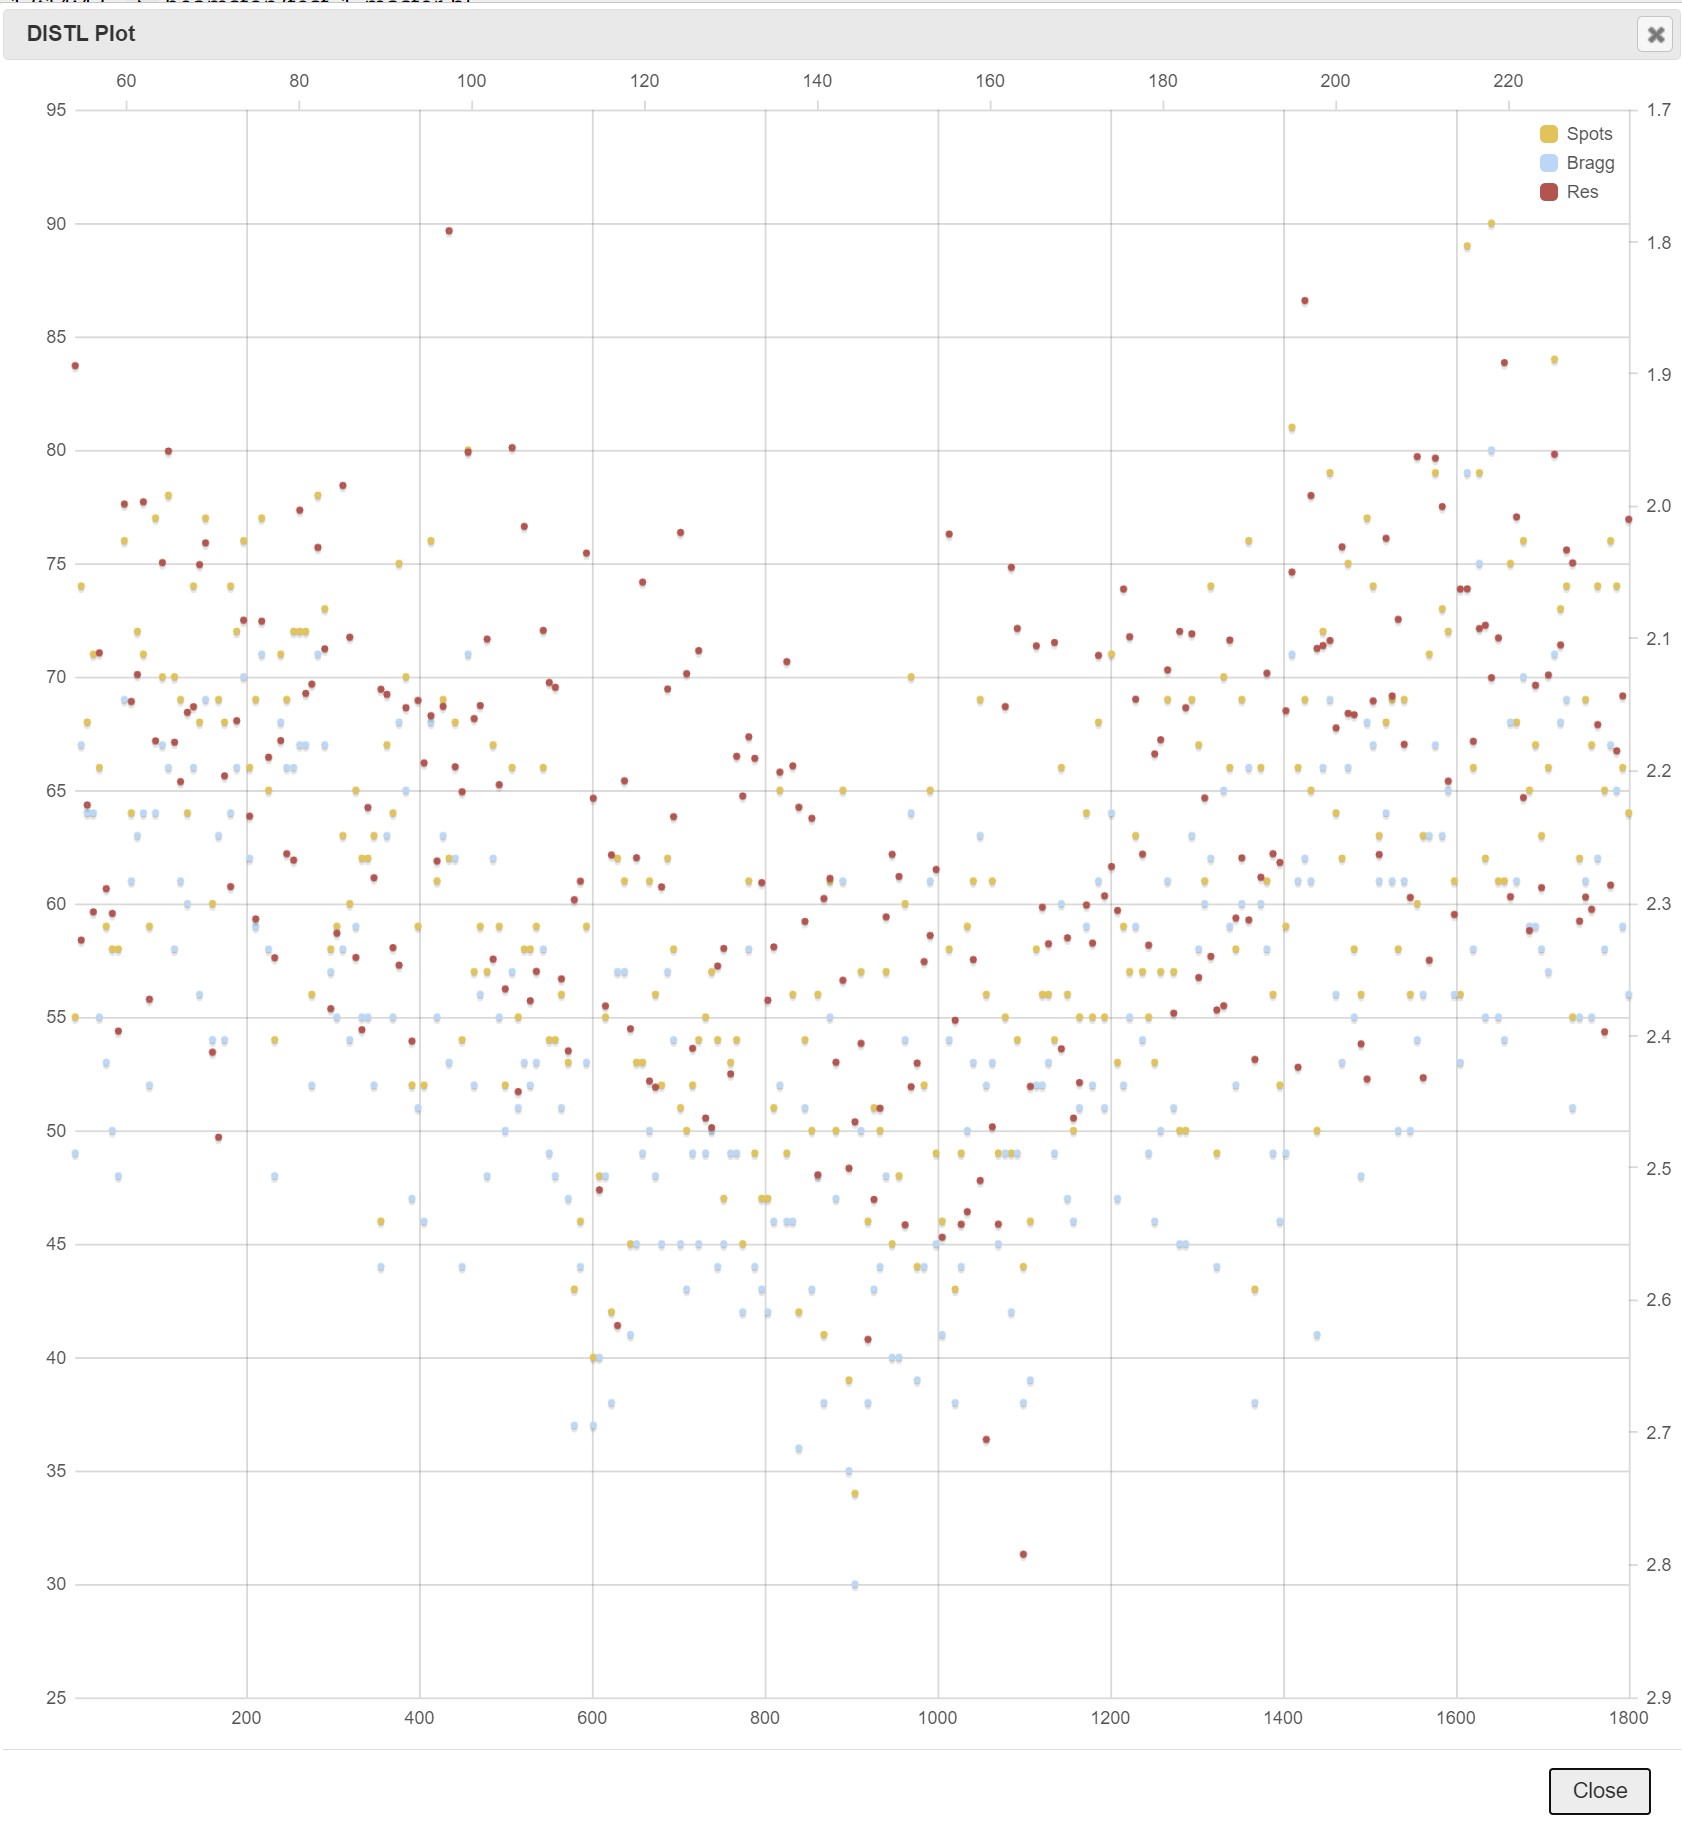
Upto 250 images evenly spaced across the dataset are displayed.
The per image analysis plot can be used to make quick assessments of diffraction to aid decision on whether the crystal should be re-collect due to incorrect alignment, or if a batch of crystals are poorly difracting.
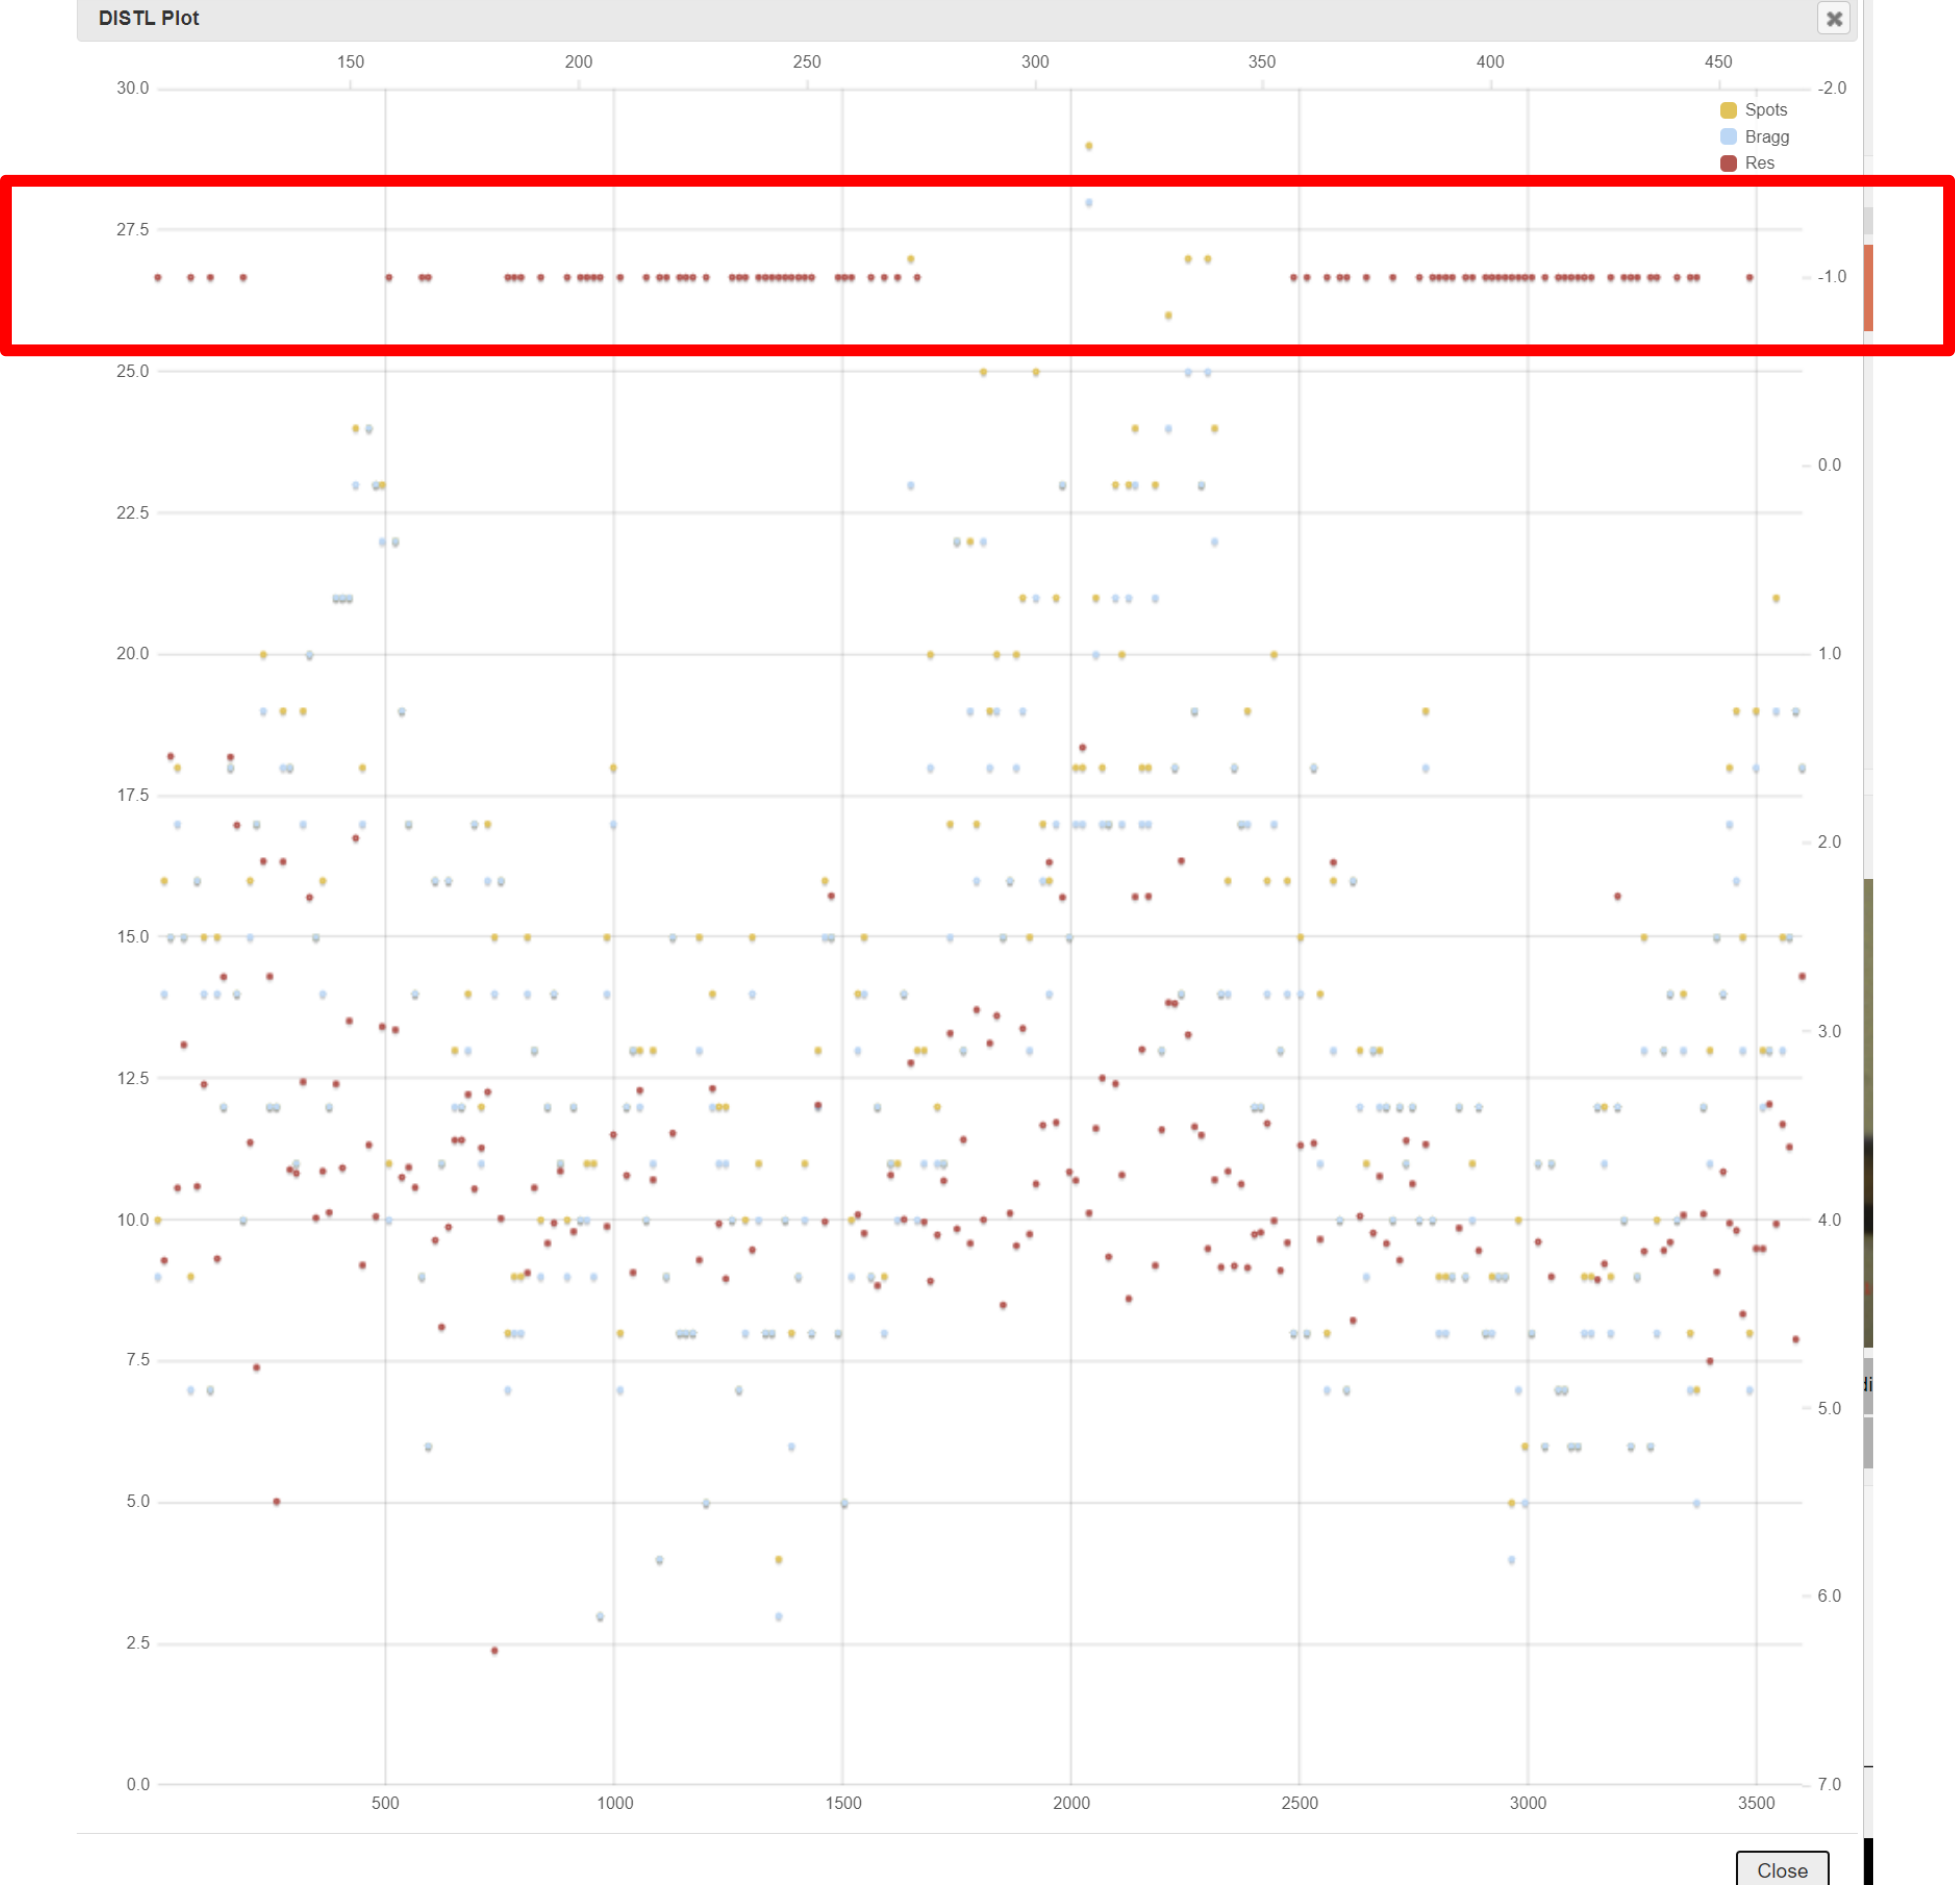
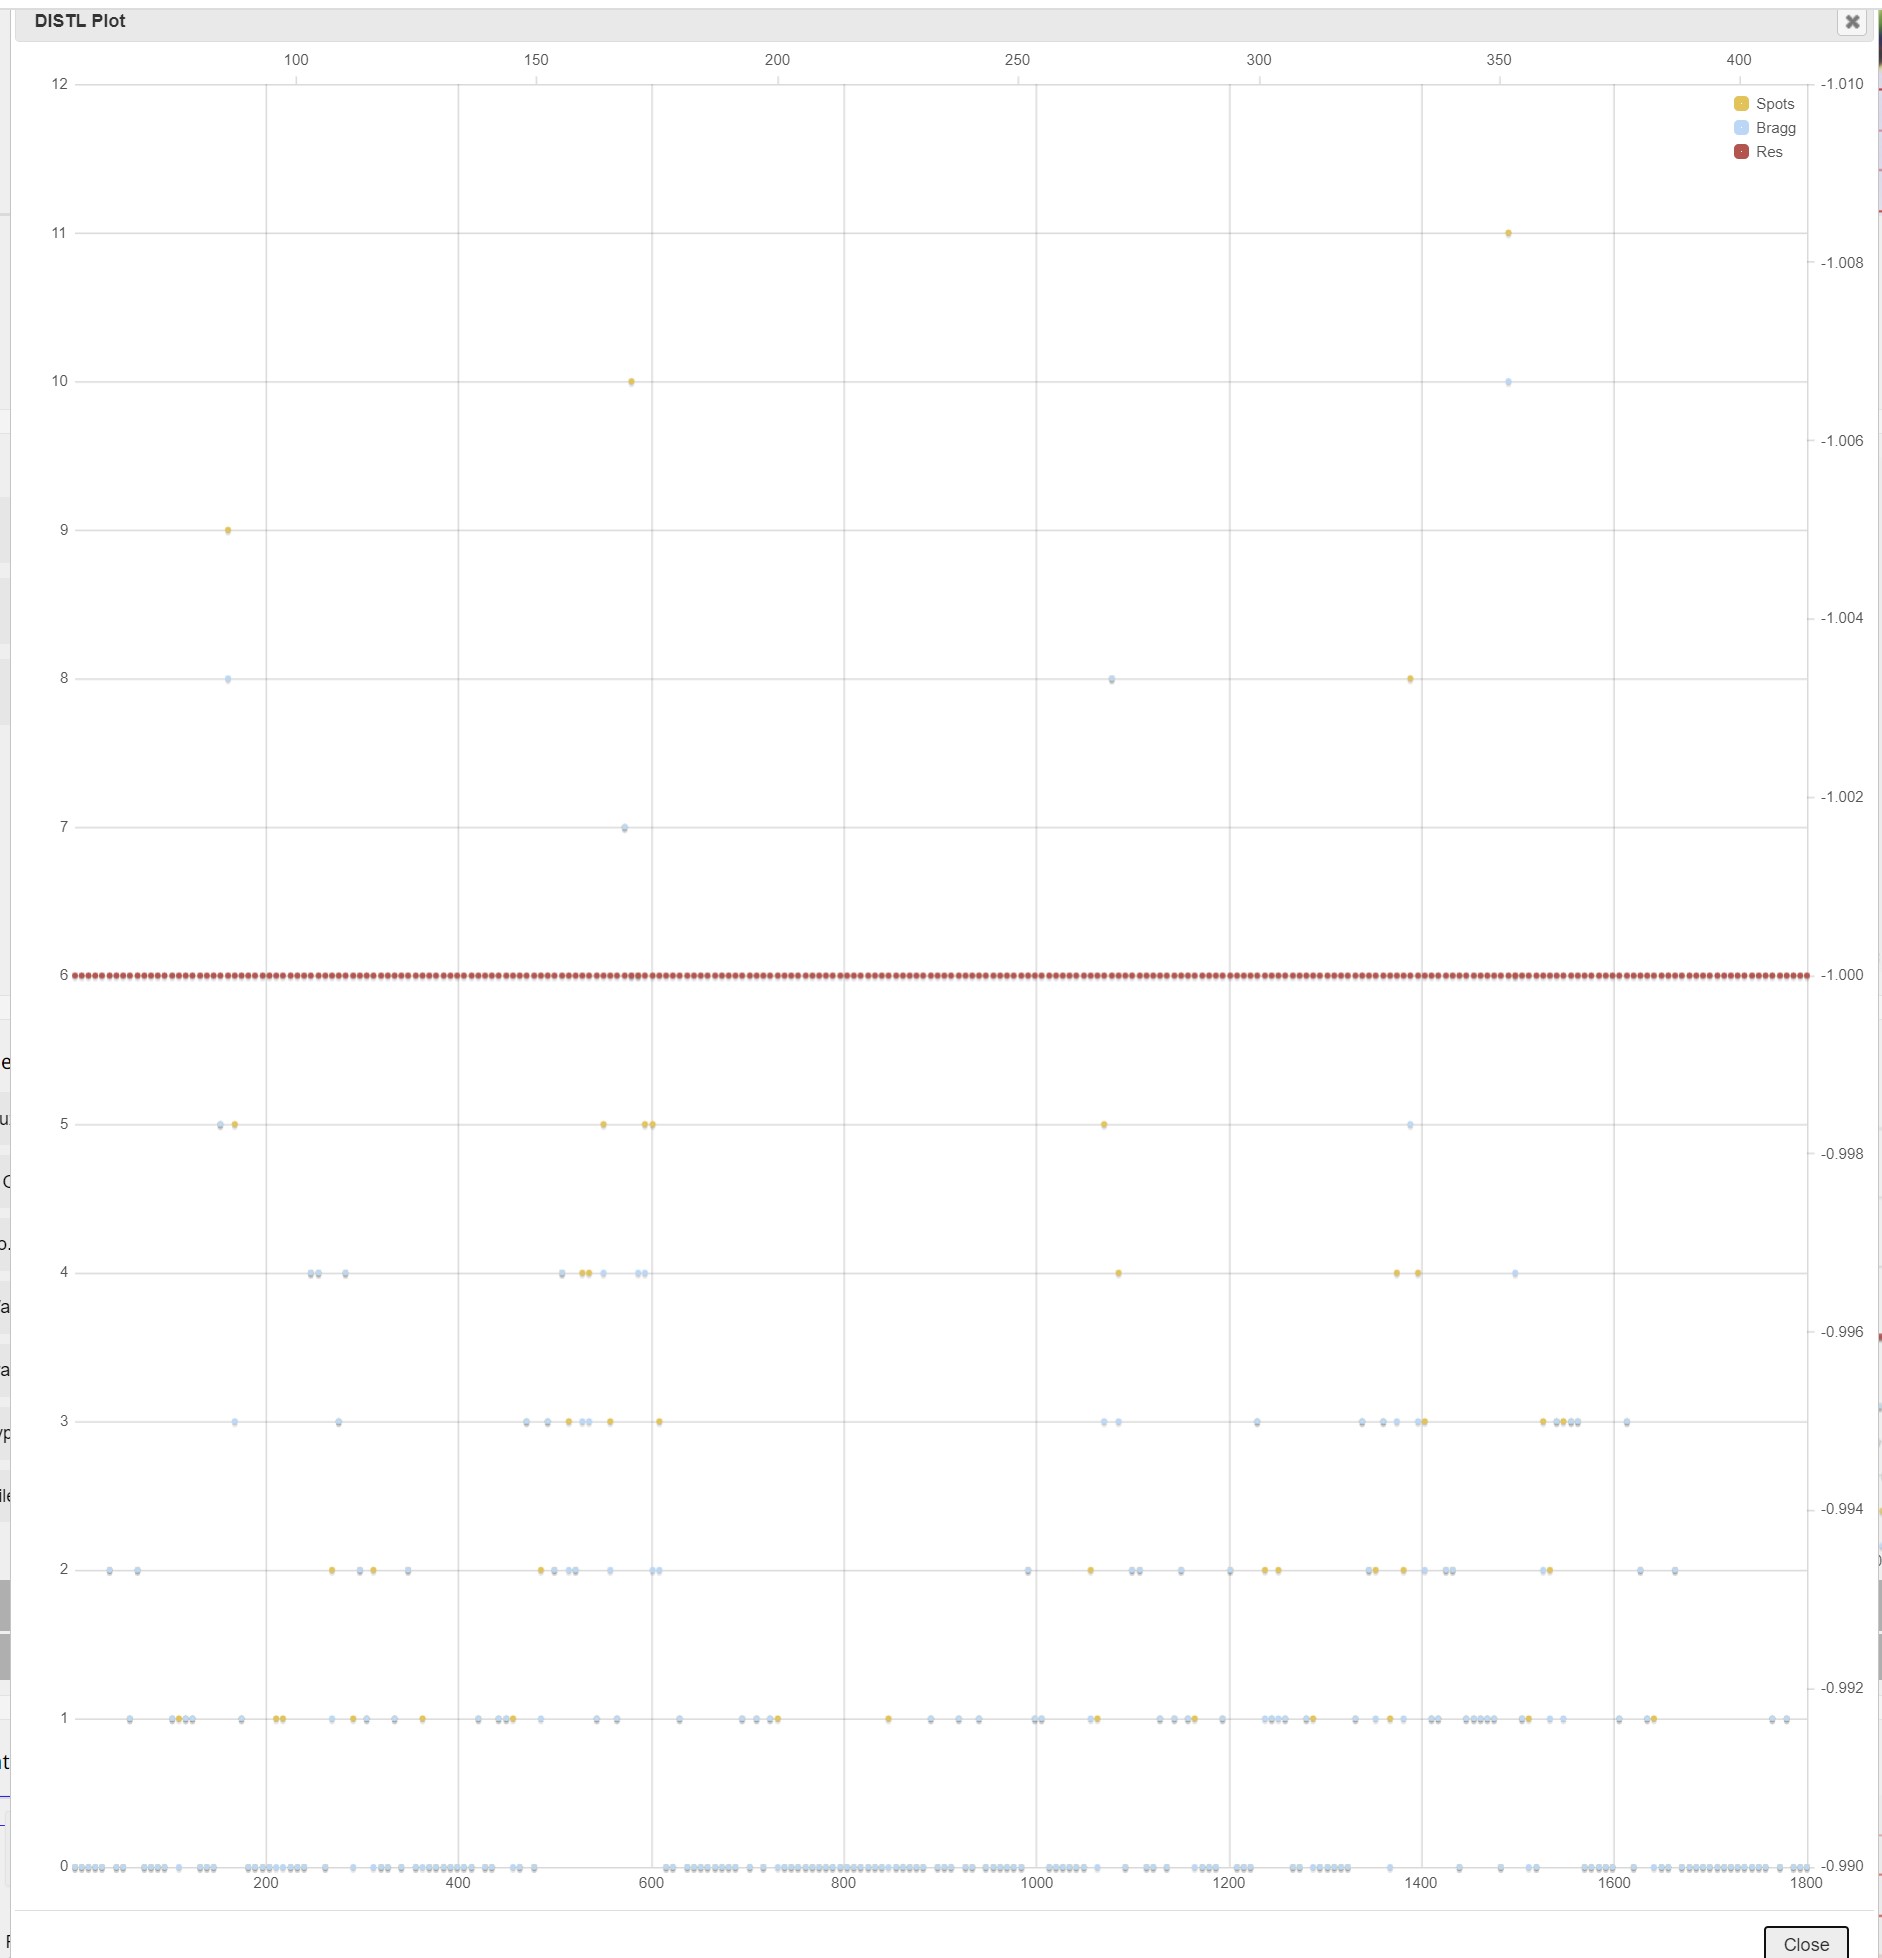
If -1 is shown for the resolution estimate, it could not be determined for that image. When this shows for a few images only it may be a a sign of relatively few spots per image. When shown for all iamges it may show more signficant issues with the underlying data, such as a lack of diffraction in the below example:
Rotation of the sample out of the beam is usually shown by an indicative drop and then return of spots:
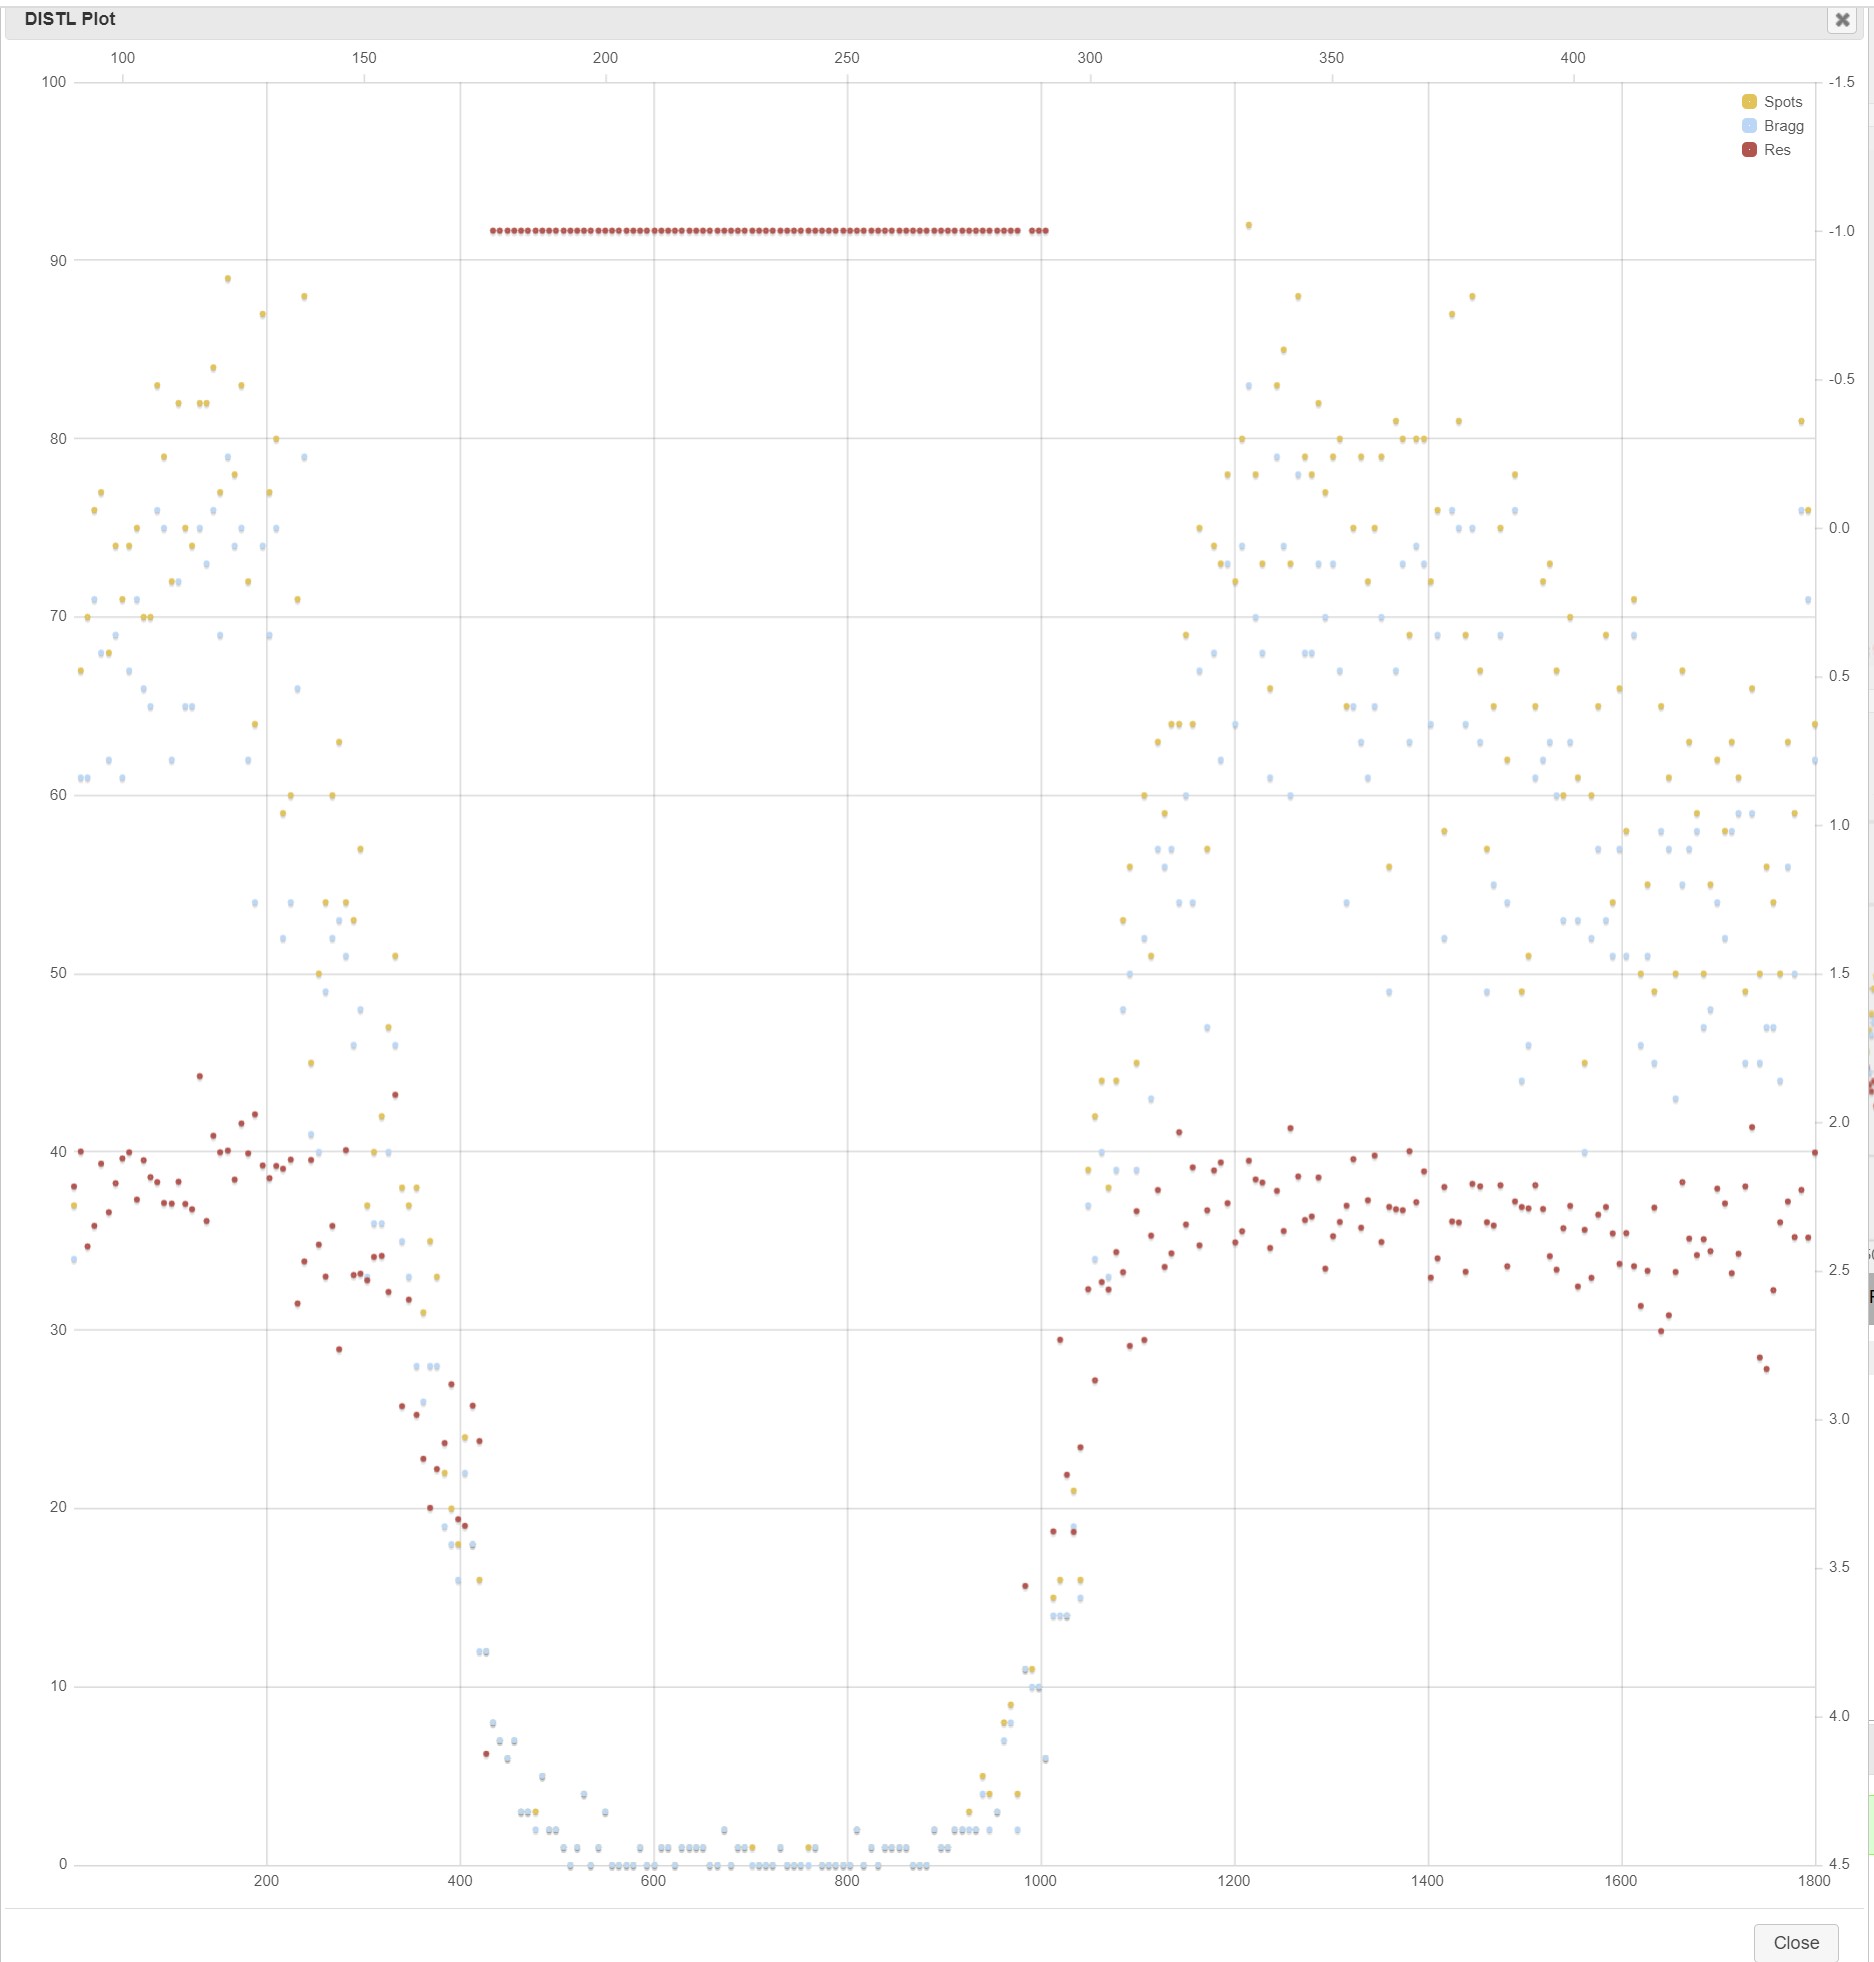
If there is a consitent dall off of spots (a downward slope) throughout the full rotation of the crystal it indicate intensity decay for radiation damge to the crystal. This can also be assessed with the radiation damage plot.
The calculations are made usings DIALS.

Diamond Light Source is the UK's national synchrotron science facility, located at the Harwell Science and Innovation Campus in Oxfordshire.
Diamond Light Source Ltd
Diamond House
Harwell Science & Innovation Campus
Didcot
Oxfordshire
OX11 0DE
Copyright © Diamond Light Source. Diamond Light Source® and the Diamond logo are registered trademarks of Diamond Light Source Ltd
Registered in England and Wales at Diamond House, Harwell Science and Innovation Campus, Didcot, Oxfordshire, OX11 0DE, United Kingdom. Company number: 4375679. VAT number: 287 461 957. Economic Operators Registration and Identification (EORI) number: GB287461957003.