Fluorescence Data
Fluorescence data are collected to identify elements of interest in the sample. Typically those are elements which can be used for phasing but they also include elements which may be bound to the protein as a complex.
Collecting an X-ray fluorescence spectrum (MCA) gives a broad indication of what is in the sample, while an edge scan provides a detailed view of single element in the sample. An MCA spectrum will contain peaks at specific energies that correlate to individual elements in the sample. Elements are excited by the incident X-ray beam and the emitted light is measured. For this to work, the incident X-ray beam must be at least 1500 eV higher than the emission energy of the elements of interest.
To collect an MCA spectrum:
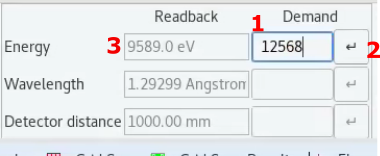
- Set the energy in GDA, typically so that incident X-ray beam must be at least 1500 eV higher than the emission energy of the elements of interest. Set with (1), press (2) and check readback changes in (3).

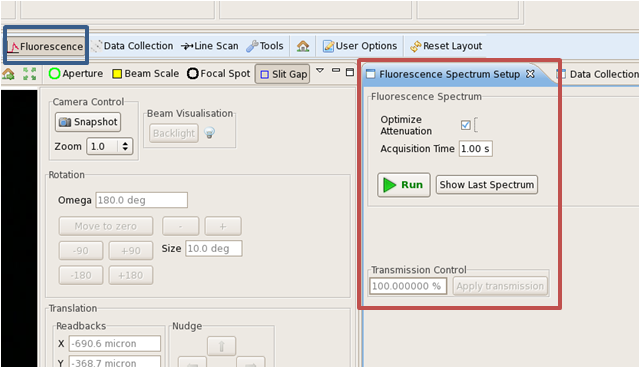
- Go to the fluorescence perspective (blue box below).
- Click on the fluorescence spectrum setup tab (red box below).
- Click 'Run'.

- If 'optimse attenuation' is selected you should obtain a spectrum with peaks for the elements in the sample.
- If no peaks are observed you could unselect 'optimise attenuation' and change the transmission to a fixed value e.g. 20% and collect data again. This will expose your crystal to more radiation.
- AutoPyMCA will run and you can run PyMCA to analyse spectra.
Spectra taken at energy sufficently above peak:

Spectra taken at too low energy, the identified peaks are noise not signal:

To collect an edge scan:
- Go to the fluorescence perspective (blue box below).
- Click on the fluorescence scan seting tab (red box below).
- Select the element of interest from the alphabetical pull down menu of atomic symbols or the alphabetical list of names.
- In elements with K edges, they will be selected automatically. Otherwise select the desired L edge. Those possible will be listed.
- The edge energies will be automatically generated from the provided information. You can edit these values but this should not be necessary.
- Provide a filename and any additional comments for your record.
- Click 'Run'.
- If 'optimise attenutation is selected the transmission will be optimised to find a signal. (If if optimises to a high transmission (e.g. 100%) it is highly unlikely the anomalous scatterer is present.)
- CHOOCH will automatically open to show the interpretation of results.
Zn Edge scan:


 Macromolecular Crystallography
