Instruments by Science Group
I14 Contact
I14 Control room:
Tel: +44 (0) 1235 778570
Principal Beamline Scientist:
Majid Kazemian
Email: [email protected]
Tel: +44 (0) 1235 778222
Science Group Leader
Julia Parker
Email: [email protected]
Tel: +44 (0)1235 778924
I14 Hard X-ray Nanoprobe
Status: Operational
Beamsize: 50nm x 50nm
Energy: 5 - 20 keV
Energy: 5 - 20 keV
What it tells you: what your sample is made of and where different elements are (at a 50 nm scale!)
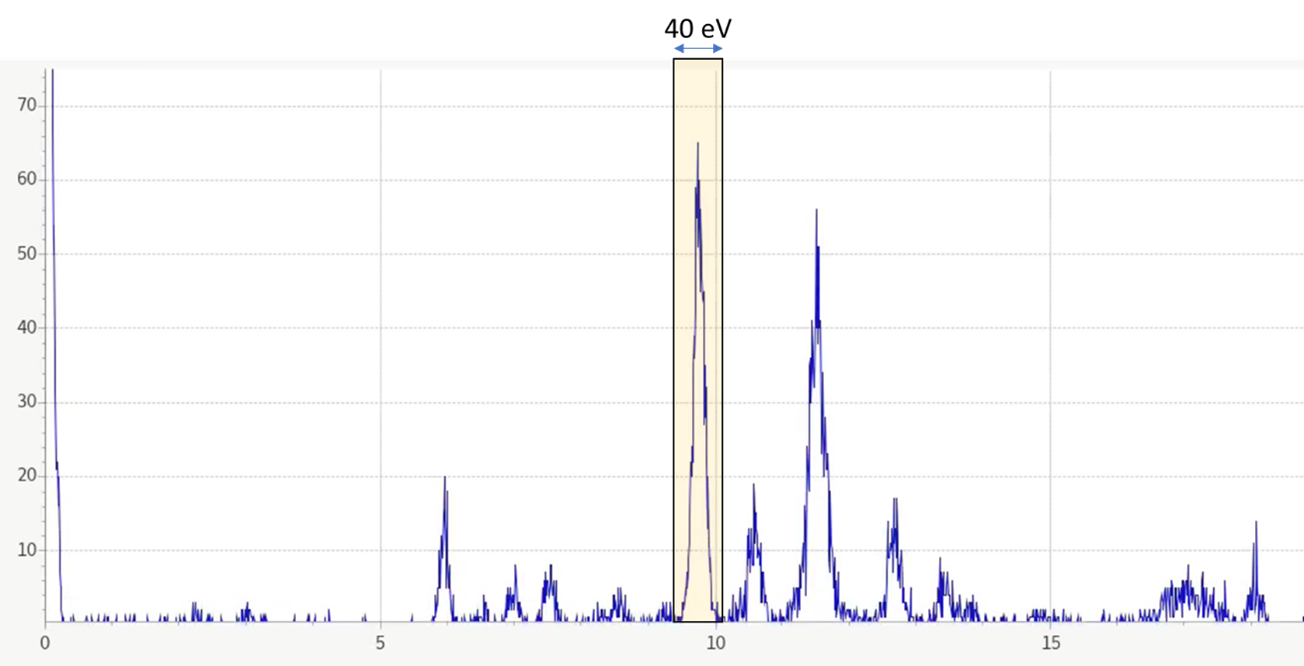
X-ray fluorescence is a 2D elemental mapping technique that has a 50 nm spatial resolution at I14, and provides information on the chemical composition and elemental distribution in the sample. Our XRF detector is in backscatter, so we can obtain transmission data simultaneously (DPC and XRD).
At each pixel, our fluorescence detector measures a full X-ray fluorescence spectrum.
We can ‘window’ the spectra to see how a specific element intensity varies in your sample (e.g. the 40 eV window in the figure). This allows us to produce a map of elemental distribution for each element.
Things to consider:
What beam energy you use – Our beam energy range is from 5-20 keV. We collect in backscatter geometry, so around the beam energy we have a large backscatter peak. You should choose an energy at least 1.5 keV above the characteristic X-ray fluorescent line you are most interested in.
You will be able to map all elements that have an absorption value (different from the fluorescence energy value) below the energy you have chosen, but X-ray lines below 2 keV will be difficult to distinguish unless your concentration is very high.
The closer you are to the absorption energy of the element of interest, the more intensity you will get, but too close, and the backscatter peak might overlap. Your local contact can help you decide what energy is most suitable.
Post processing – You may want to consider fitting your spectra rather than using windowing if you have elements close together in energy. Watch out for L lines as well as K lines! We generally use pymca for this task, more information can be found by navigating through: I14 beamtime and access> After your beamtime> Data analysis and interpretation.
Sample thickness – XRF isn’t a surface technique, so thicker samples may experience some loss of resolution due to overlapping material behind the area of interest and penetration of the X-rays. The amount the beam penetrates into your sample will be affected by the composition. Likewise, pure materials or relatively thicker sections may generate too much fluorescent signal, saturating the XRF detector. Therefore, it is really important to discuss the best sample preparation strategy with your local contact beforehand.
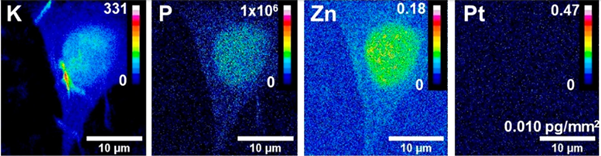
Image from E. M. Bolitho, C. Sanchez-Cano, H. Shi, P. D. Quinn, M. Harkiolaki, C. Imberti, P. J. Sadler, JACS, 2021, 143, 48, 20224-20240 (https://pubs.acs.org/doi/10.1021/jacs.1c08630)

Diamond Light Source is the UK's national synchrotron science facility, located at the Harwell Science and Innovation Campus in Oxfordshire.
Diamond Light Source Ltd
Diamond House
Harwell Science & Innovation Campus
Didcot
Oxfordshire
OX11 0DE
Copyright © Diamond Light Source. Diamond Light Source® and the Diamond logo are registered trademarks of Diamond Light Source Ltd
Registered in England and Wales at Diamond House, Harwell Science and Innovation Campus, Didcot, Oxfordshire, OX11 0DE, United Kingdom. Company number: 4375679. VAT number: 287 461 957. Economic Operators Registration and Identification (EORI) number: GB287461957003.