Instruments by Science Group
I14 Contact
I14 Control room:
Tel: +44 (0) 1235 778570
Principal Beamline Scientist:
Majid Kazemian
Email: [email protected]
Tel: +44 (0) 1235 778222
Science Group Leader
Julia Parker
Email: [email protected]
Tel: +44 (0)1235 778924
I14 Hard X-ray Nanoprobe
Status: Operational
Beamsize: 50nm x 50nm
Energy: 5 - 20 keV
Energy: 5 - 20 keV
What it tells you: the spatial distribution of electronic states in your sample
The XANES signal strongly varies with the coordination geometry and oxidation state, and helps to distinguish what specific elements are bound to, and their electronic state – for example, is it Fe2+ or Fe3+? Is it FeO or FeS? It can be used as a fingerprint to identify the chemical environment of a particular element in an unknown sample.
At I14, we can create a stacked map that has a XANES spectra for each pixel, showing you how different states are spread out, for example where is the Fe 2+, and where is the Fe 3+ within a particle?
To create a XANES map, we use our fluorescence detector to take an individual XRF map at a range of energies over the edge of your desired element. The default energy range is quite comprehensive (~150 points), with 0.5 to 1 eV increases in and around the maximum of XANES peak. However, this energy list is totally customisable if you aim to acquire a longer range or finer energy steps at a particular region. For larger areas, in-situ experiments, or samples sensitive to x-ray dose, we can use our novel sparse XANES technique, where we collect a small portion of the measurements and numerically recover the missing entries to speed up mapping time (for more information, see Sparse Scanning).
Things to consider:
Time – We collect XRF maps at 150 different energies over the specific element edge so this can be time consuming (150 energies x the time your map takes).
Signal – Insufficient amounts of the element of interest in your sample will lead to a noisy spectra. As rule of thumb, check that the intensity of the studied element has at least 500 counts, when measuring at 0.5 keV over the K- or L-edge electronic transition.
Standards – XANES relies on having adequate reference spectra to understand what is going on in your sample. This is because the spectrum of an unknown sample can generally be understood as a linear superposition of two or more spectra from known samples. Hence, you need to think carefully what compounds/minerals are able to chemically “explain” your sample, and bring these to the beamtime (as films, foils, or (diluted) pellets). Generally, a XANES standard for a reference material would take ~15-20 minutes acquisition time.
Post processing – Our in-house python scripts and automatic reconstructions methods will provide you a stacked, normalised and aligned XANES file, which you can interrogate using MANTiS or DAWN. Linear combination fitting analysis using Athena will help you to understand the extracted clusters or principal components by comparing them against the abovementioned XANES standards. For more info, have a look at: I14 beamtime and access> After your beamtime> Data analysis and interpretation.
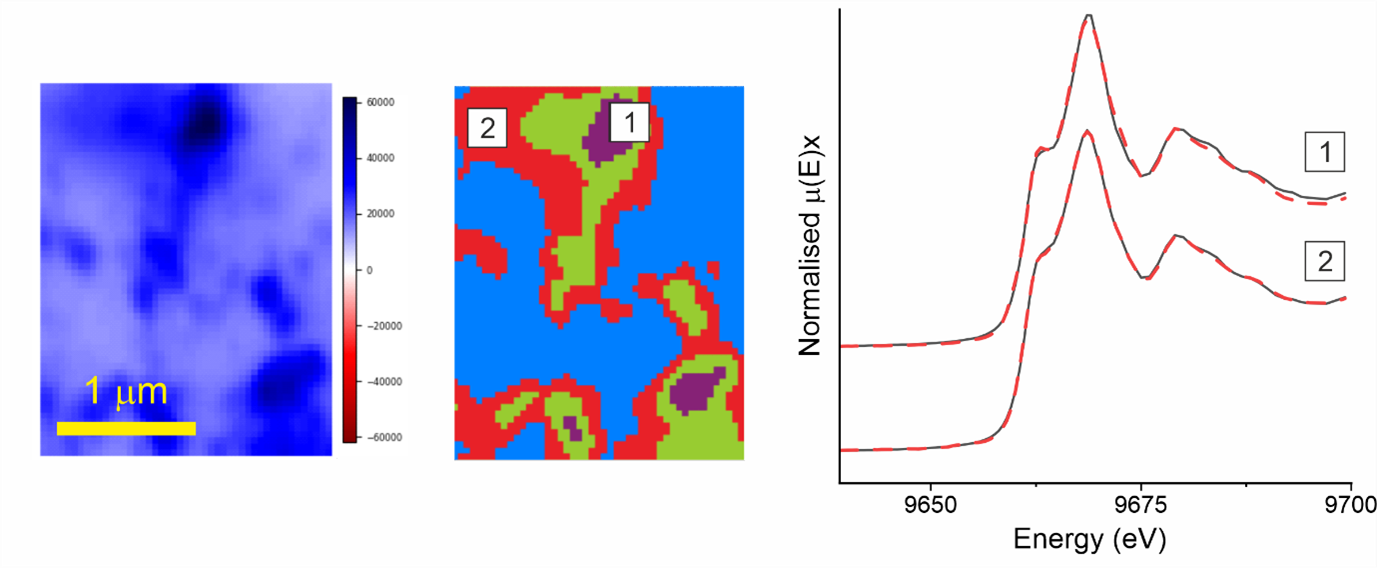
The average XANES spectrum from the violet [1] and red [2] clusters are presented at the right,
together with the linear combination fitting analysis performed by Athena (red-dashed line).
Image taken with permission from the authors of the article:
https://onlinelibrary.wiley.com/doi/full/10.1002/gch2.202300036.

Diamond Light Source is the UK's national synchrotron science facility, located at the Harwell Science and Innovation Campus in Oxfordshire.
Diamond Light Source Ltd
Diamond House
Harwell Science & Innovation Campus
Didcot
Oxfordshire
OX11 0DE
Copyright © Diamond Light Source. Diamond Light Source® and the Diamond logo are registered trademarks of Diamond Light Source Ltd
Registered in England and Wales at Diamond House, Harwell Science and Innovation Campus, Didcot, Oxfordshire, OX11 0DE, United Kingdom. Company number: 4375679. VAT number: 287 461 957. Economic Operators Registration and Identification (EORI) number: GB287461957003.