Multi-Crystal Data
Wedges of data collected from multiple crystals can be processed together using xia2 multiplex and multixia2. This will happen automatically if you follow some simple rules for collecting data and these are outlined below. Detailed notes on multi-crystal data processing with DIALS/xia2 can be found here
https://xia2.github.io/multiplex-multi-crystal.html
https://dials.github.io/documentation/tutorials/multi_crystal_symmetry_and_scaling.html
and a summary tutorial of how to manually utilise xia2 to combine multiple sweeps.
Collecting the data
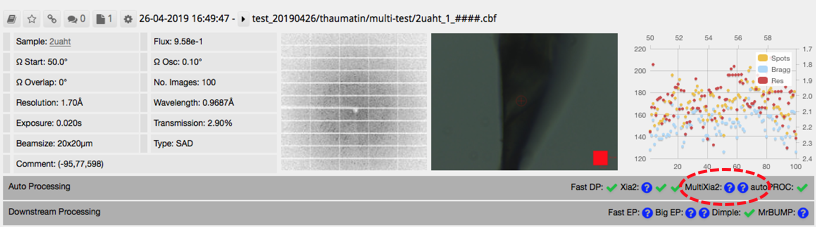
A: Multixia2 - run on data collection groups, i.e. those set up in GDA data collection table with more than 1 data collection on 1 crystal, e.g. inverse beam, multi-wedged MAD, etc.
B: xia2 multiplex (note that this will only run if dials has successfully run).
- Multiple collections from a crystal irrespective of directory
- Multiple collections in the same directory irrespective of proteinname or acronym
- Unit cell analysis done – will reject outliers.
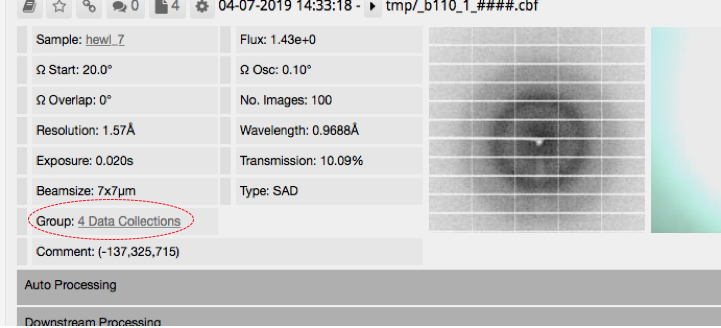
Finding the results for multixia2 (A)
At first glance, it will look like the queued data collections do not appear in ispyb. Click on 'group' (circled in the image below) to see the individual data collections
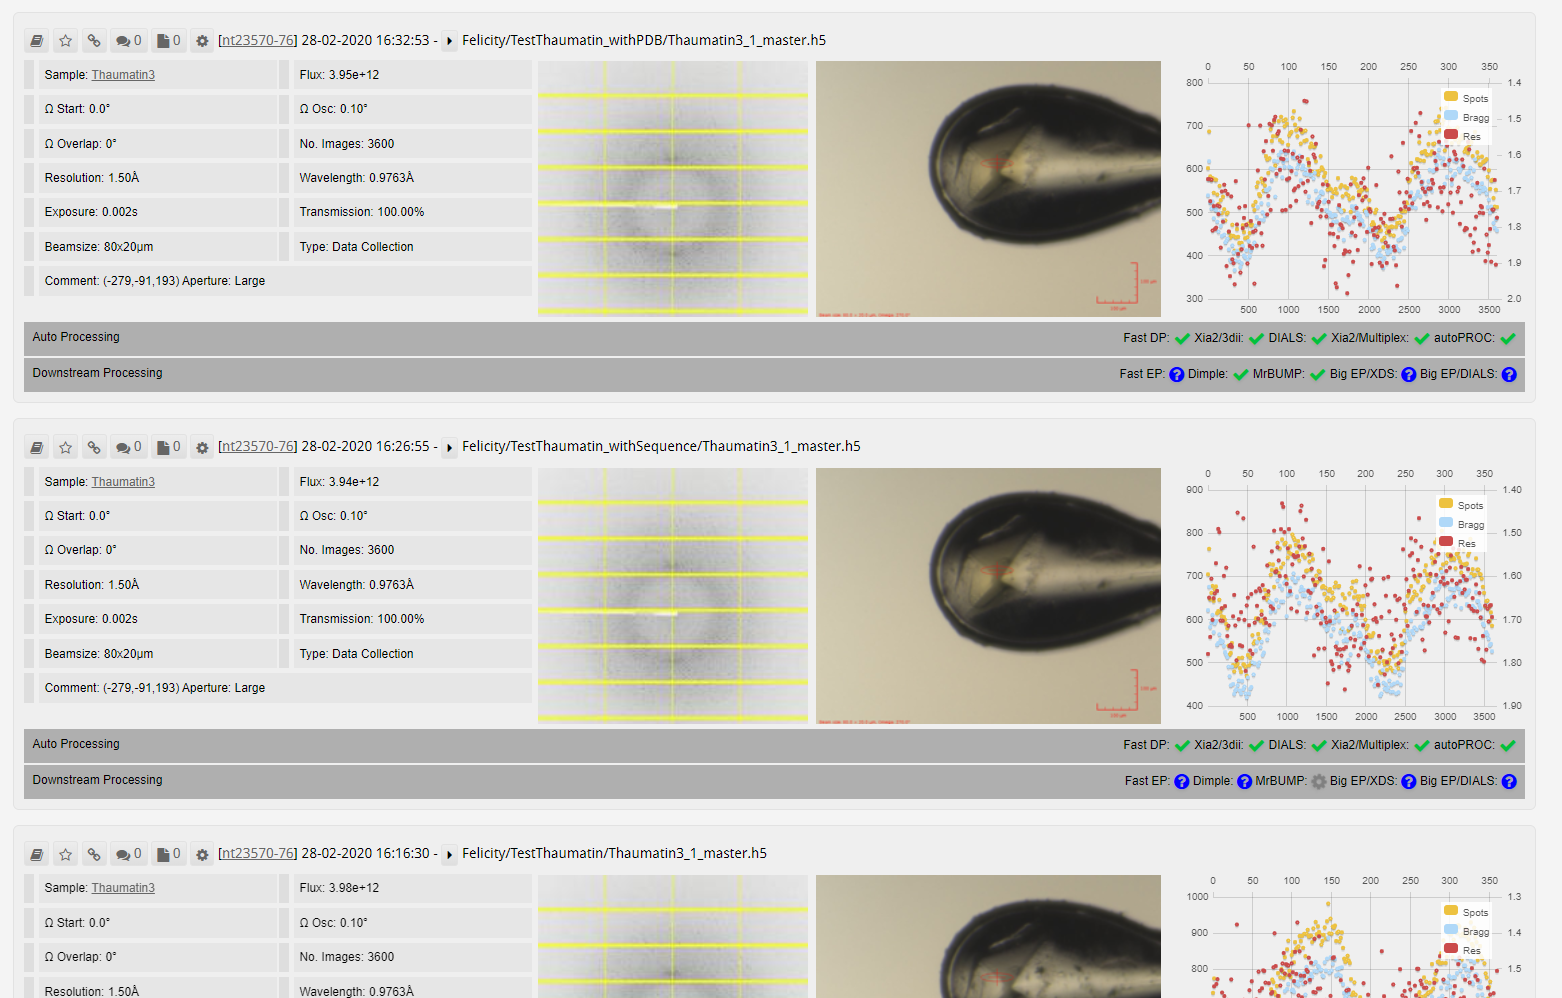
Finding the results for multiplex (B)
Note that ticks will not appear where you might expect (circled below) even if this has run successfully.
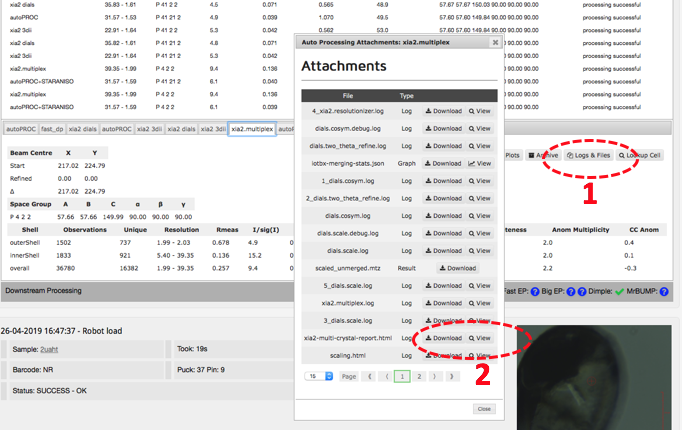
Click on the auto processing bar and you should see a xia2.multiplex tab with a summary of scaling stats. The most informative statistics can be found in the multiplex log. Click on 'logs and files' (1 below) and then on 'Download' or 'View' (2) next to xia2-multi-crystal-report.html.
This page contains a nice summary of the merging statistics but also some useful plots highlighting how the data from the different crystals have merged together
e.g.
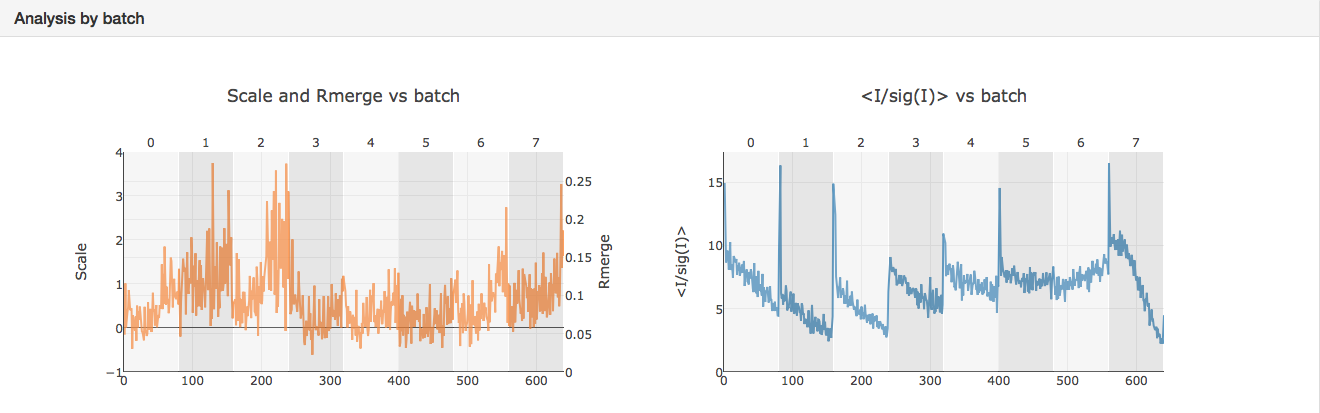
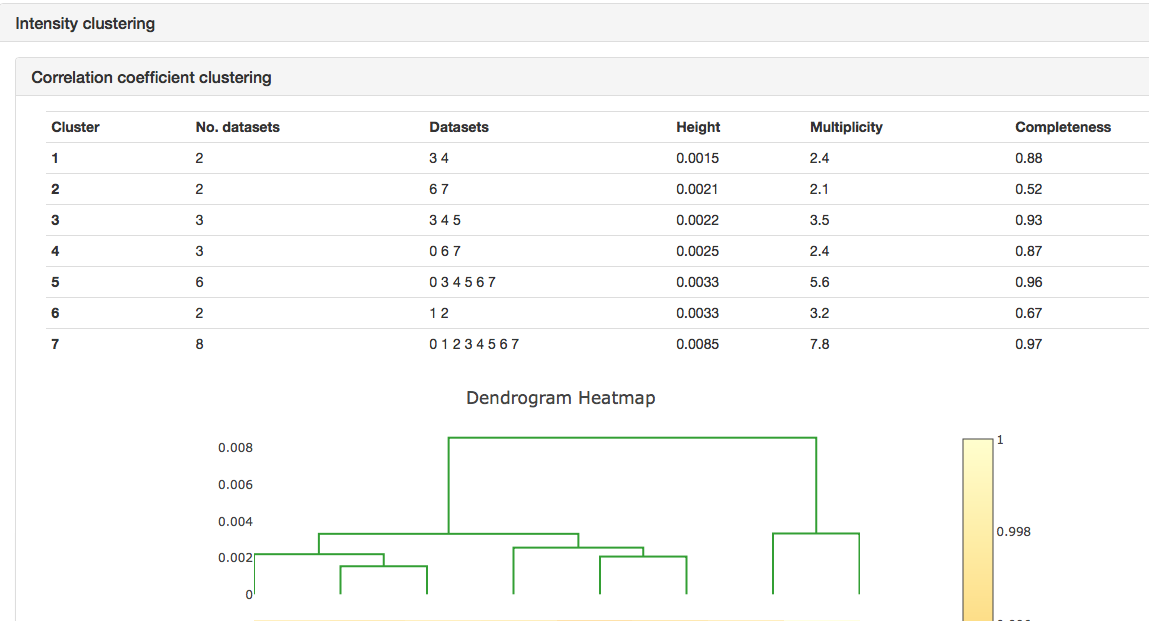
It can be seen that the merging stats in the top table are formed from data from 8 crystals and how the I/sigI is varying within each batch. This is extremely useful if you want to assess what data to reject from reprocessing. You might also want to look at the dendrogram in intensity clustering which highlights clusters of datasets that merge well together. Looking at the below cluster 5 (datasets 0, 3, 4, 5, 6 and 7) looking promising - the data are still complete with a high level split from datasets 1 and 2.
Selecting all datasets from a multiplex run
To view all datasets related to a multiplex run, click to the autoprocessing tab , then under xia2.multiplex, and then Data Sets button takes to the datasets contributing to that autoprocessed result.
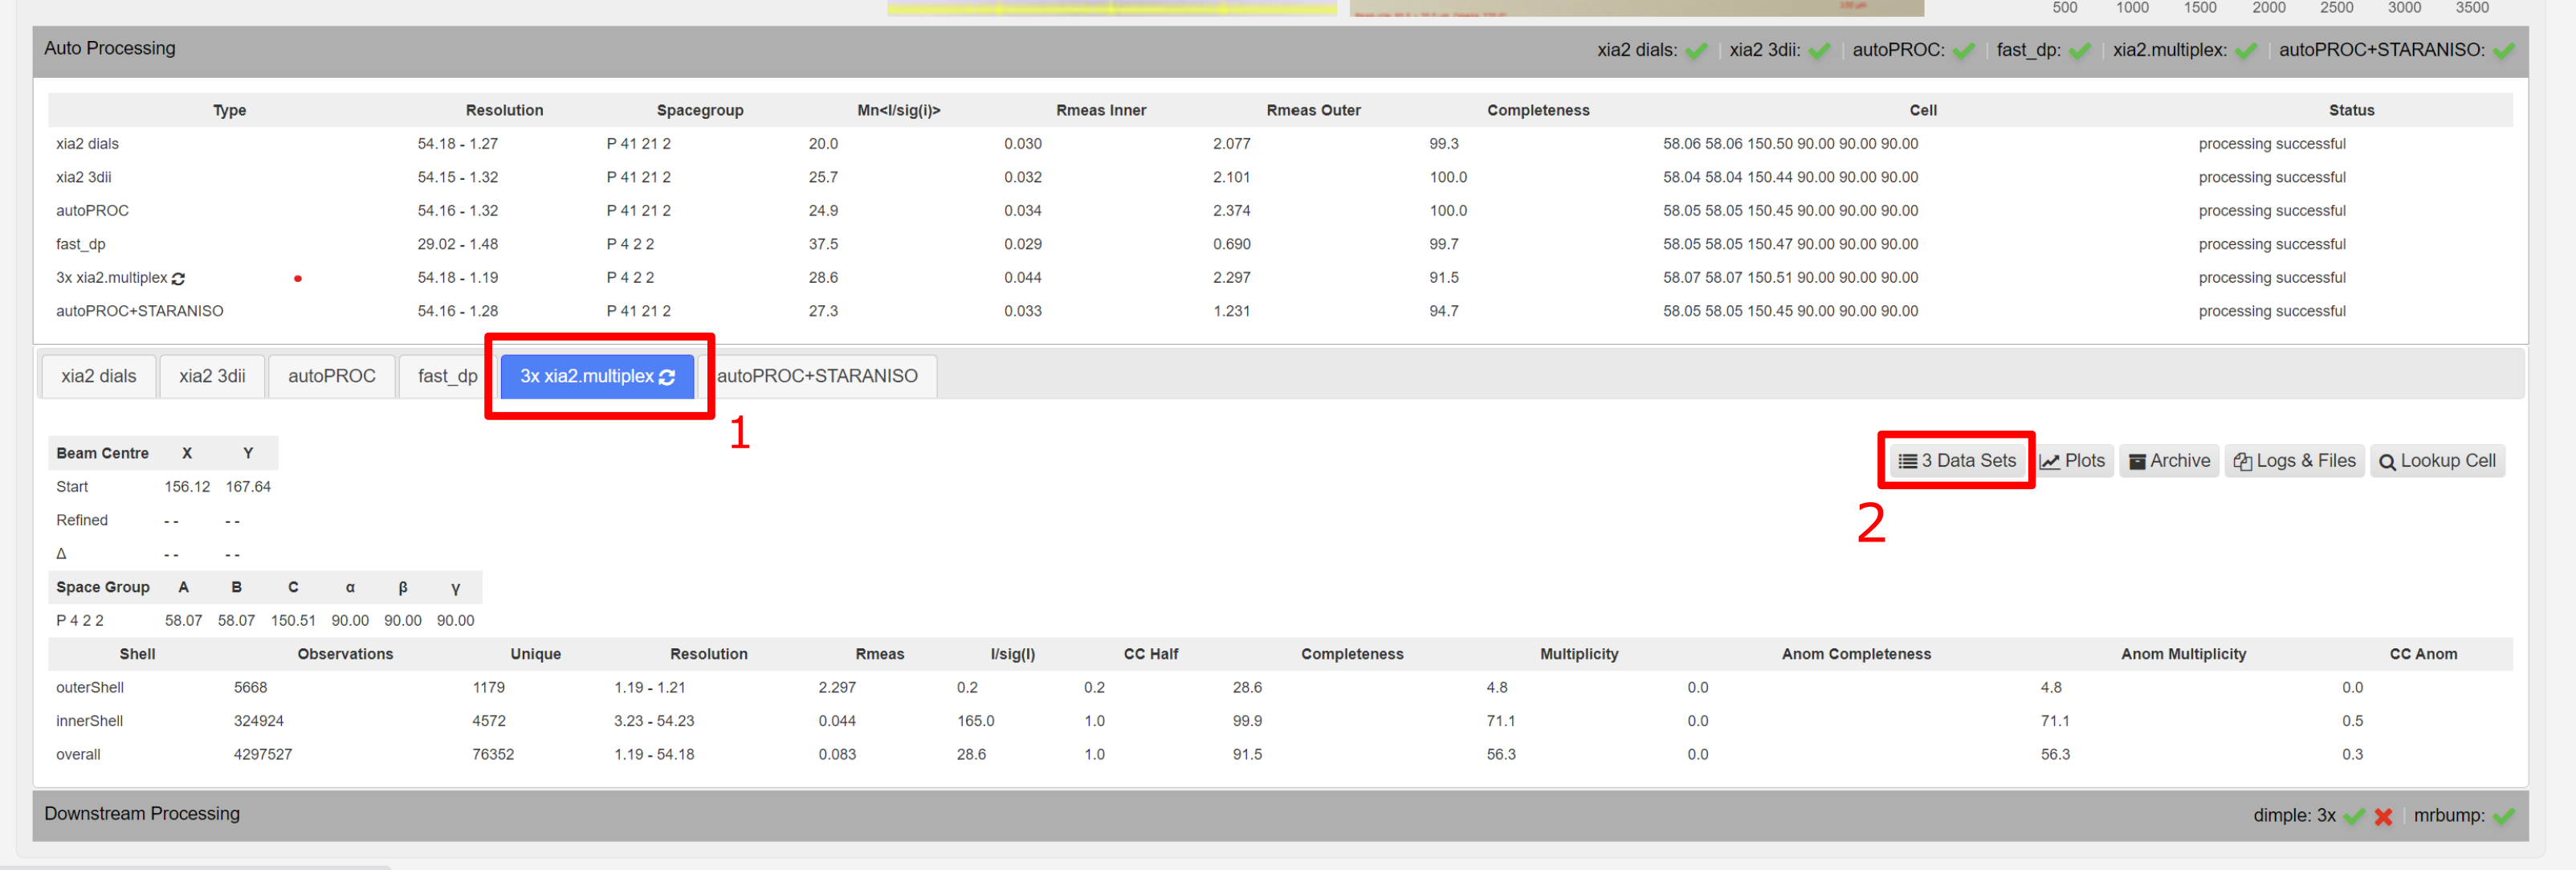
This leads to a subselection of all datsets involved in that multiple dataset processing.