Fluorescence Data
AutoPyMCA in ISPyB
Following an MCA spectrum, outlined in flouresence data collection, AutoPyMCA is run automatically to identify peaks in the fluoresence spectrum. These results are displayed in ISPYB.
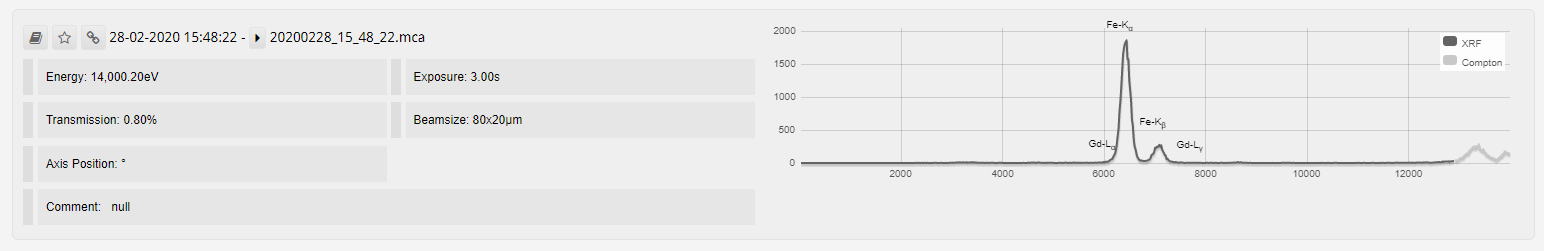
The peaks to be searched for are determined by the energy the scan is run at, and can be checked using the AutoPyMCA element analysis.
PYMCA
PyMCA can be used to view your data in two different ways. You can analyse the rgb file which is created during your run at Diamond, or convert your mca files to edf format so you can reanalyse the raw data directly.
You can download the PyMCA manual for Diamond here.
Useful links:

