Time Use in Visit & Visit Statistics
Time Use in Visit
At the top of the page in ISPyB there is a bar which shows how the time during your visit has been used.
As beamtime is a finite resource, if you would like ideas about how to make best use of your allocated beamtime then please speak with your Local Contact or with the MX Support Team ([email protected]). Thinking less and shooting more is not necessarily the answer! The key is planning what you are actually trying to achieve from your data. Being able to set up a command queue can be one useful strategy.

If you hover your mouse over the bar it will describe the category:
- Yellow - Start-up
- Dark Green - Data collection
- Light Green - Auto-indexing
- Light Blue - Centring
- Dark Blue - Robot actions
- Purple - Thinking
- Red - Remaining
Visit Statistics
You can obtain full visit statistics for your visit from ISPyB. First slect the page via the button at the top of the visit:

This will take you to a summary page for the whole visit, with multiple graphs. The first shows the actions taken over time layered upon each other.

With the bottom row showing data collections for different proteins:

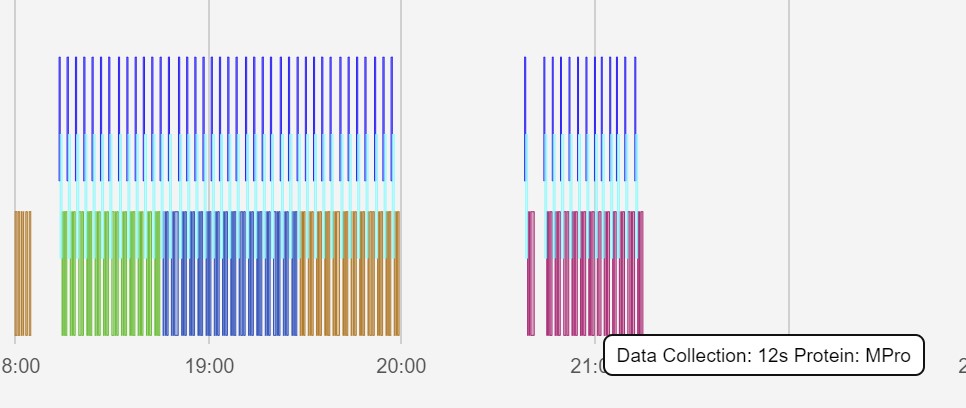
Each data collection is overlayed with the preceding centring and loading steps:

Other data collections such as Edge Scans are shown separately:

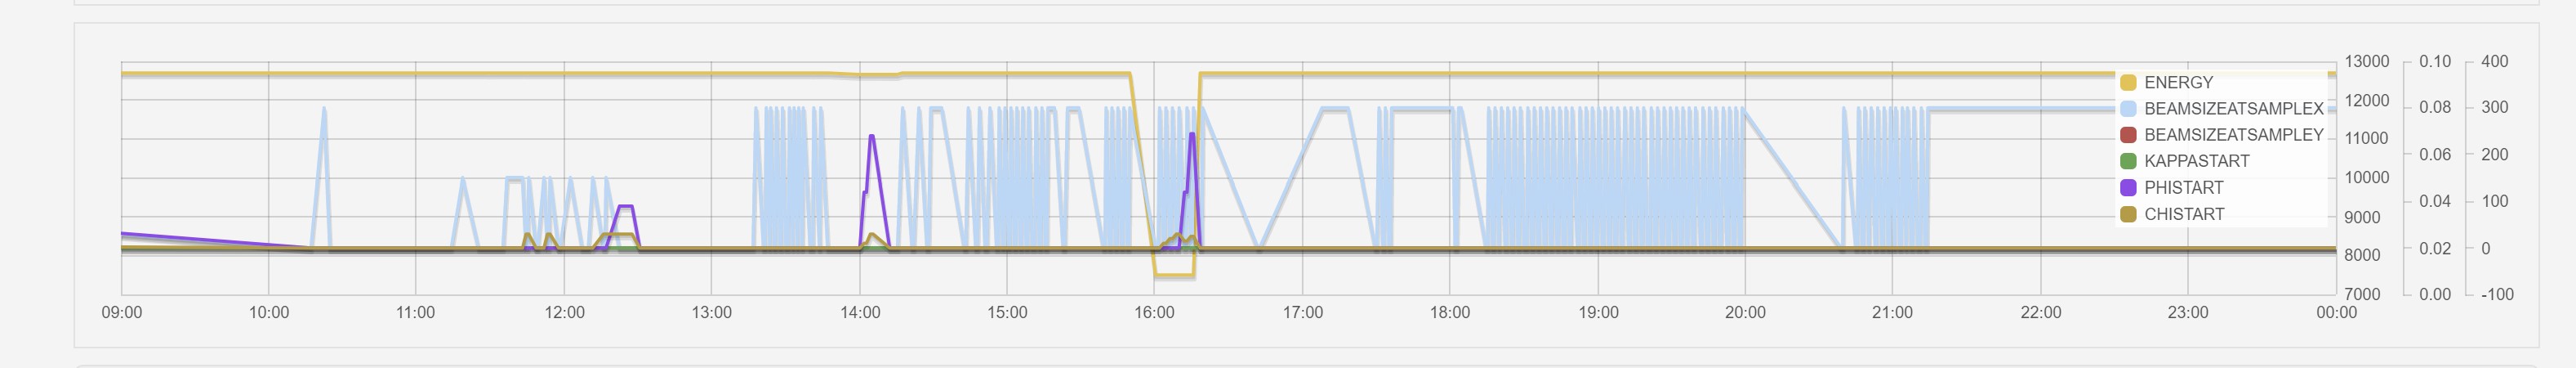
The second graph summarises the changes of beamline parameters throughout the visit:
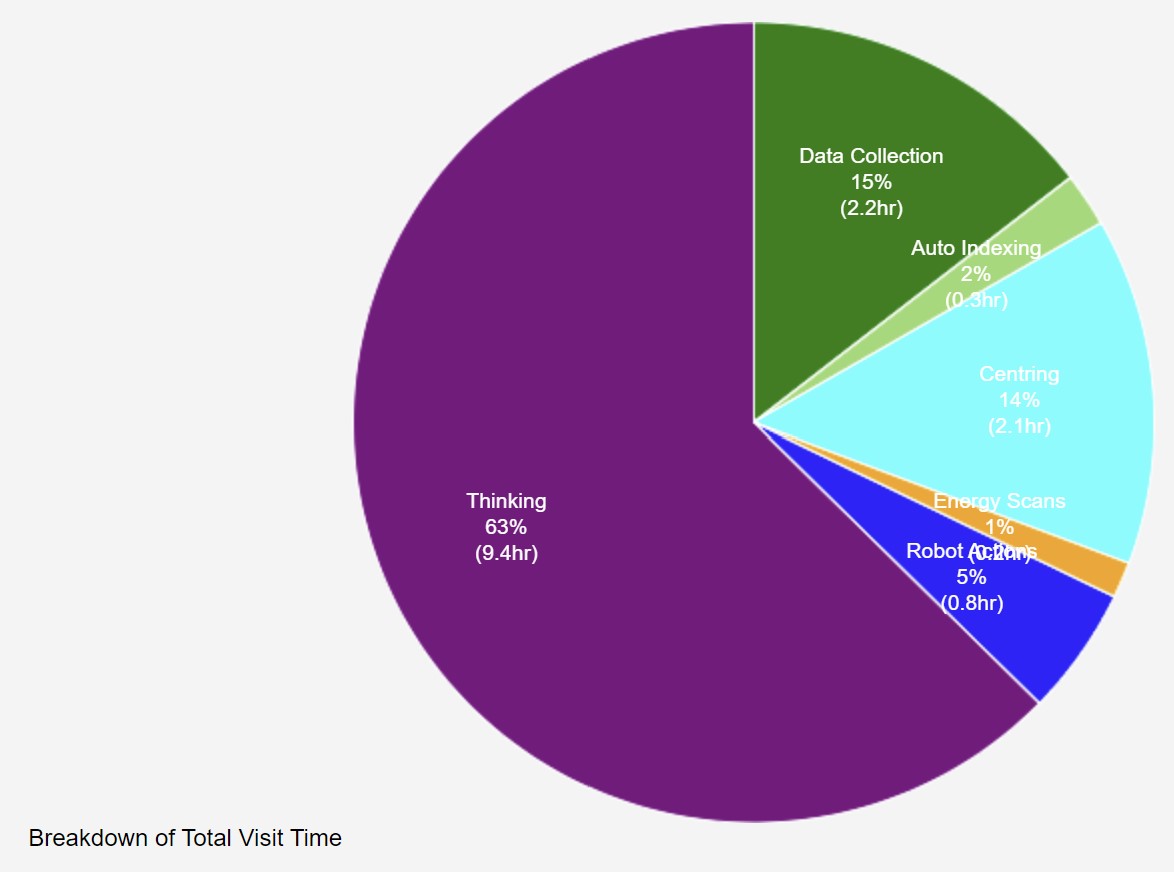
There are also some overall visit summaries, followed by a pie chart summary that uses the same colouring as the time in visit summary:
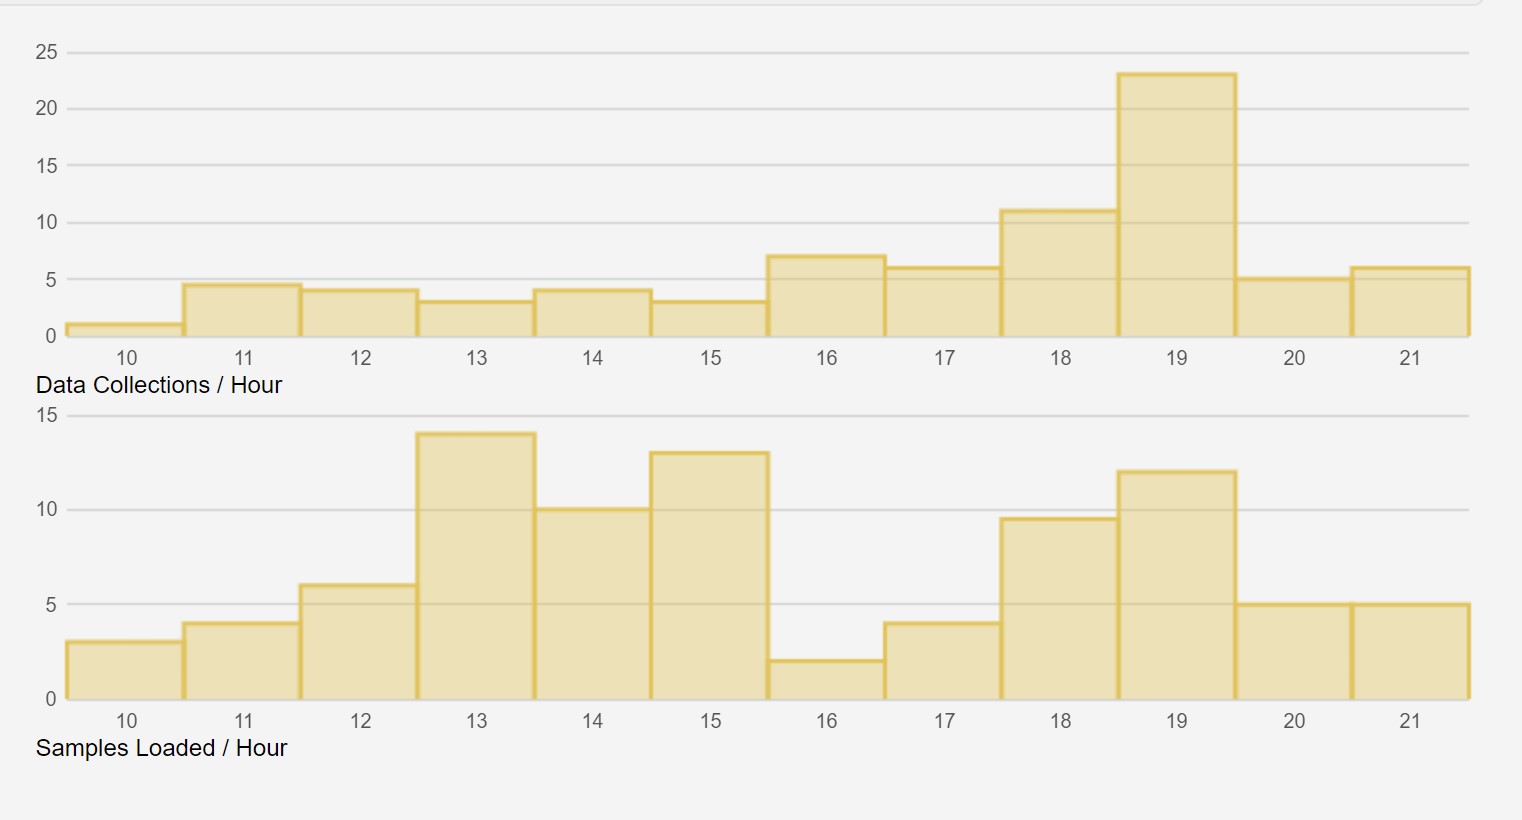
As well as a bar chart summary of samples loaded per hour as well as data collections per hour:
The robot load from each puck are summarised in the robot dewar usage graph. The critical % of robot loads is a deprecated function.

There are also tabular sumamries of Faults (logged by beamline staff), Robot Errors (Automatically logged by GDA), a log from the experimental hall coordinators (EHCs) and a log of callouts.
