Downstream Processing Results
Downstream processing in this context is the processing that is done after a scaled and merged mtz is output from the autoprocessing pipelines. It encompassess phasing and model building tasks.
Additional sample based information such as sequence, definition of anomalous scatters and PDB files are required to be defined to trigger the pipelines:
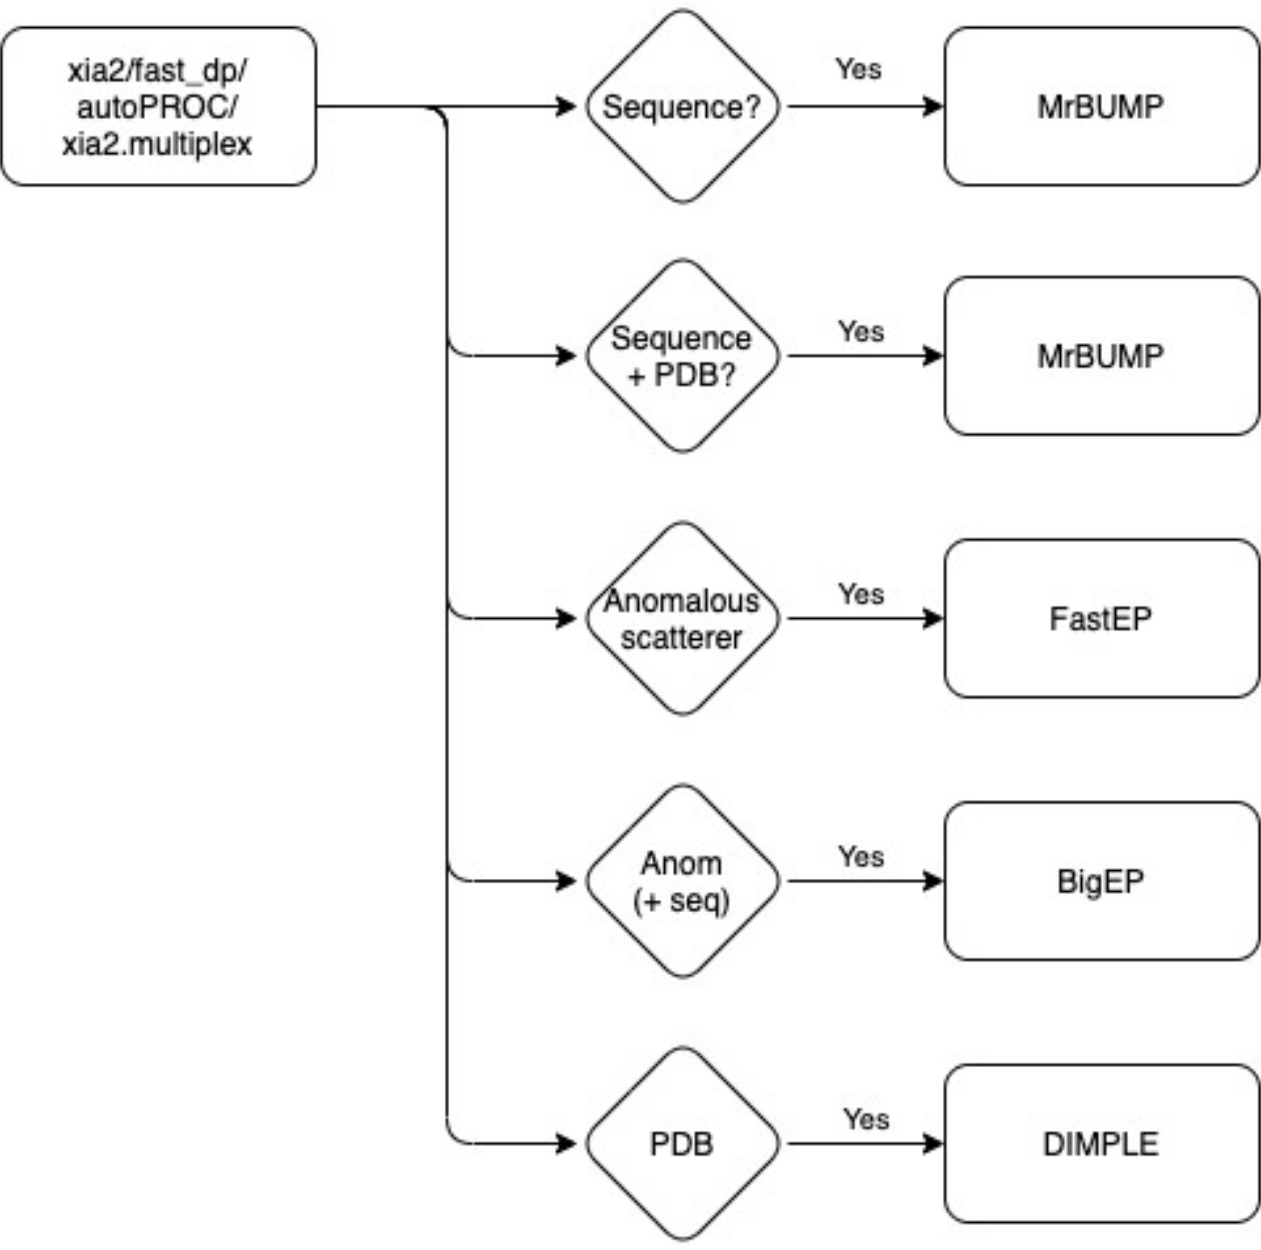
BigEP is a wrapper for the triggering of three pipelines (autoSHARP, phenix.autobuild and Crank2: Paper & CCP4i2 tutorial) for building a model within the electron density with sequence information.
Downstream processing is displayed as an expandable bar for each dataset in ISPyB:
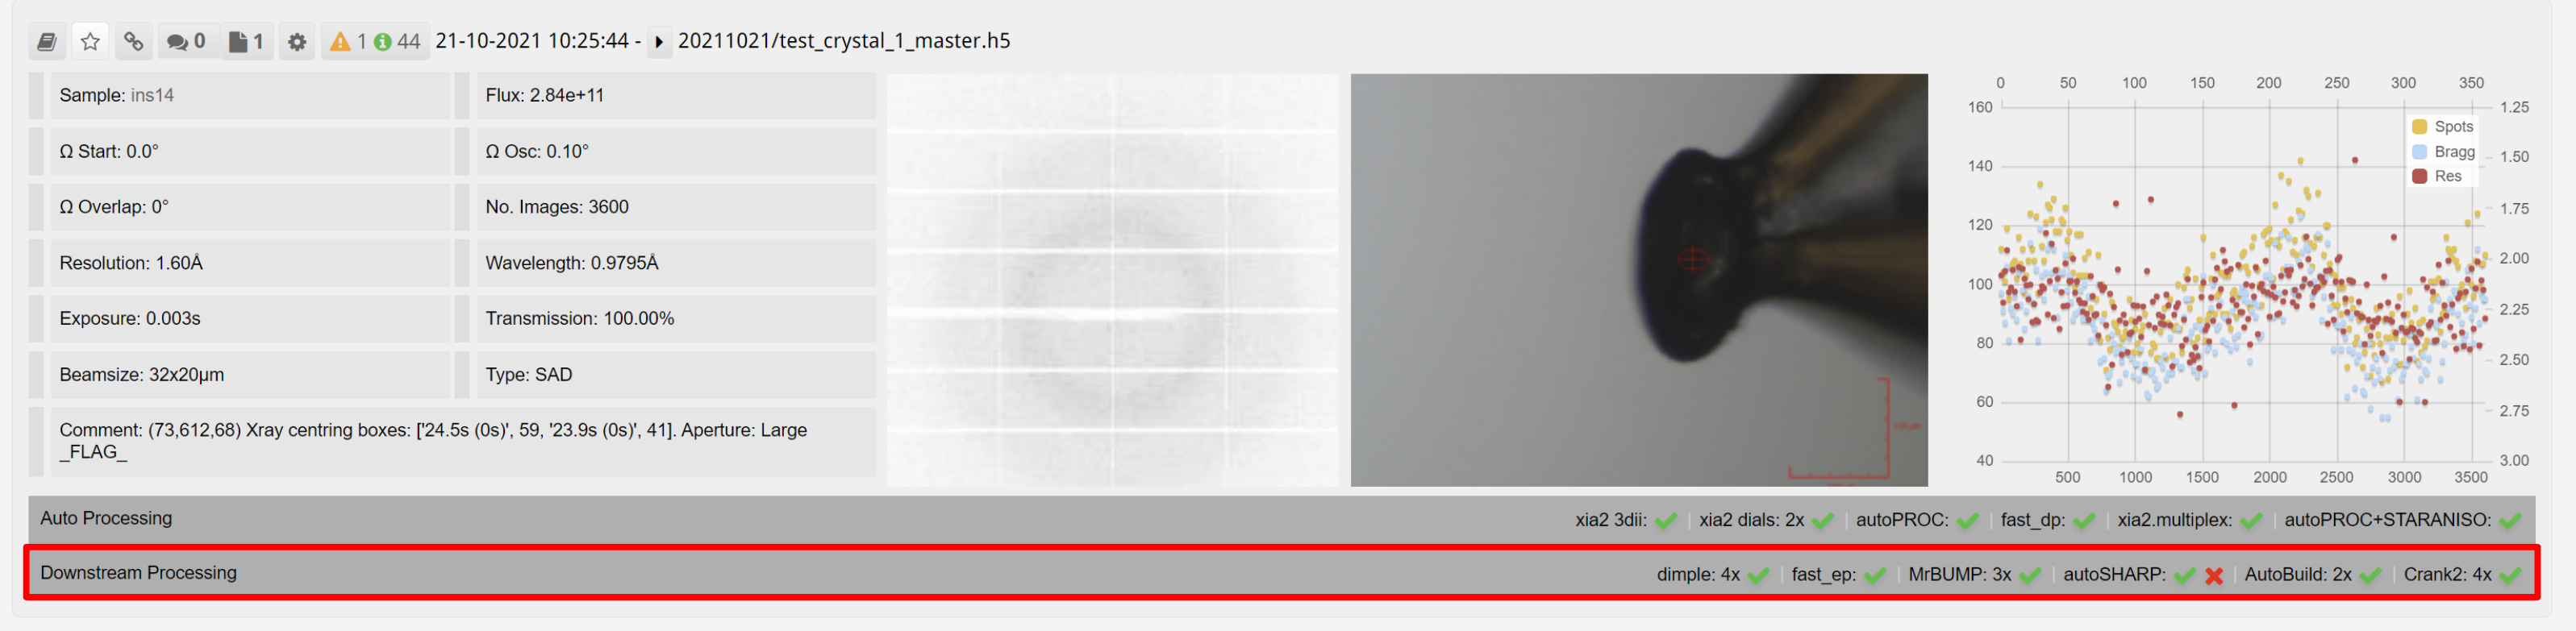
The panel expands to show the downstream processing, with tabs for each downstream process: Dimple, Fast EP, MrBump, autoSHARP, phenix.autobuild and Crank2: Paper & CCP4i2 tutorial. Within each tab are results from each of the runs of the autoprocessing software. Downstream processing tasks are normally run with a lower priority on the computational cluster, and require both autoprocessing pipeline results and user inputted information such as PDB or sequence as shown above.
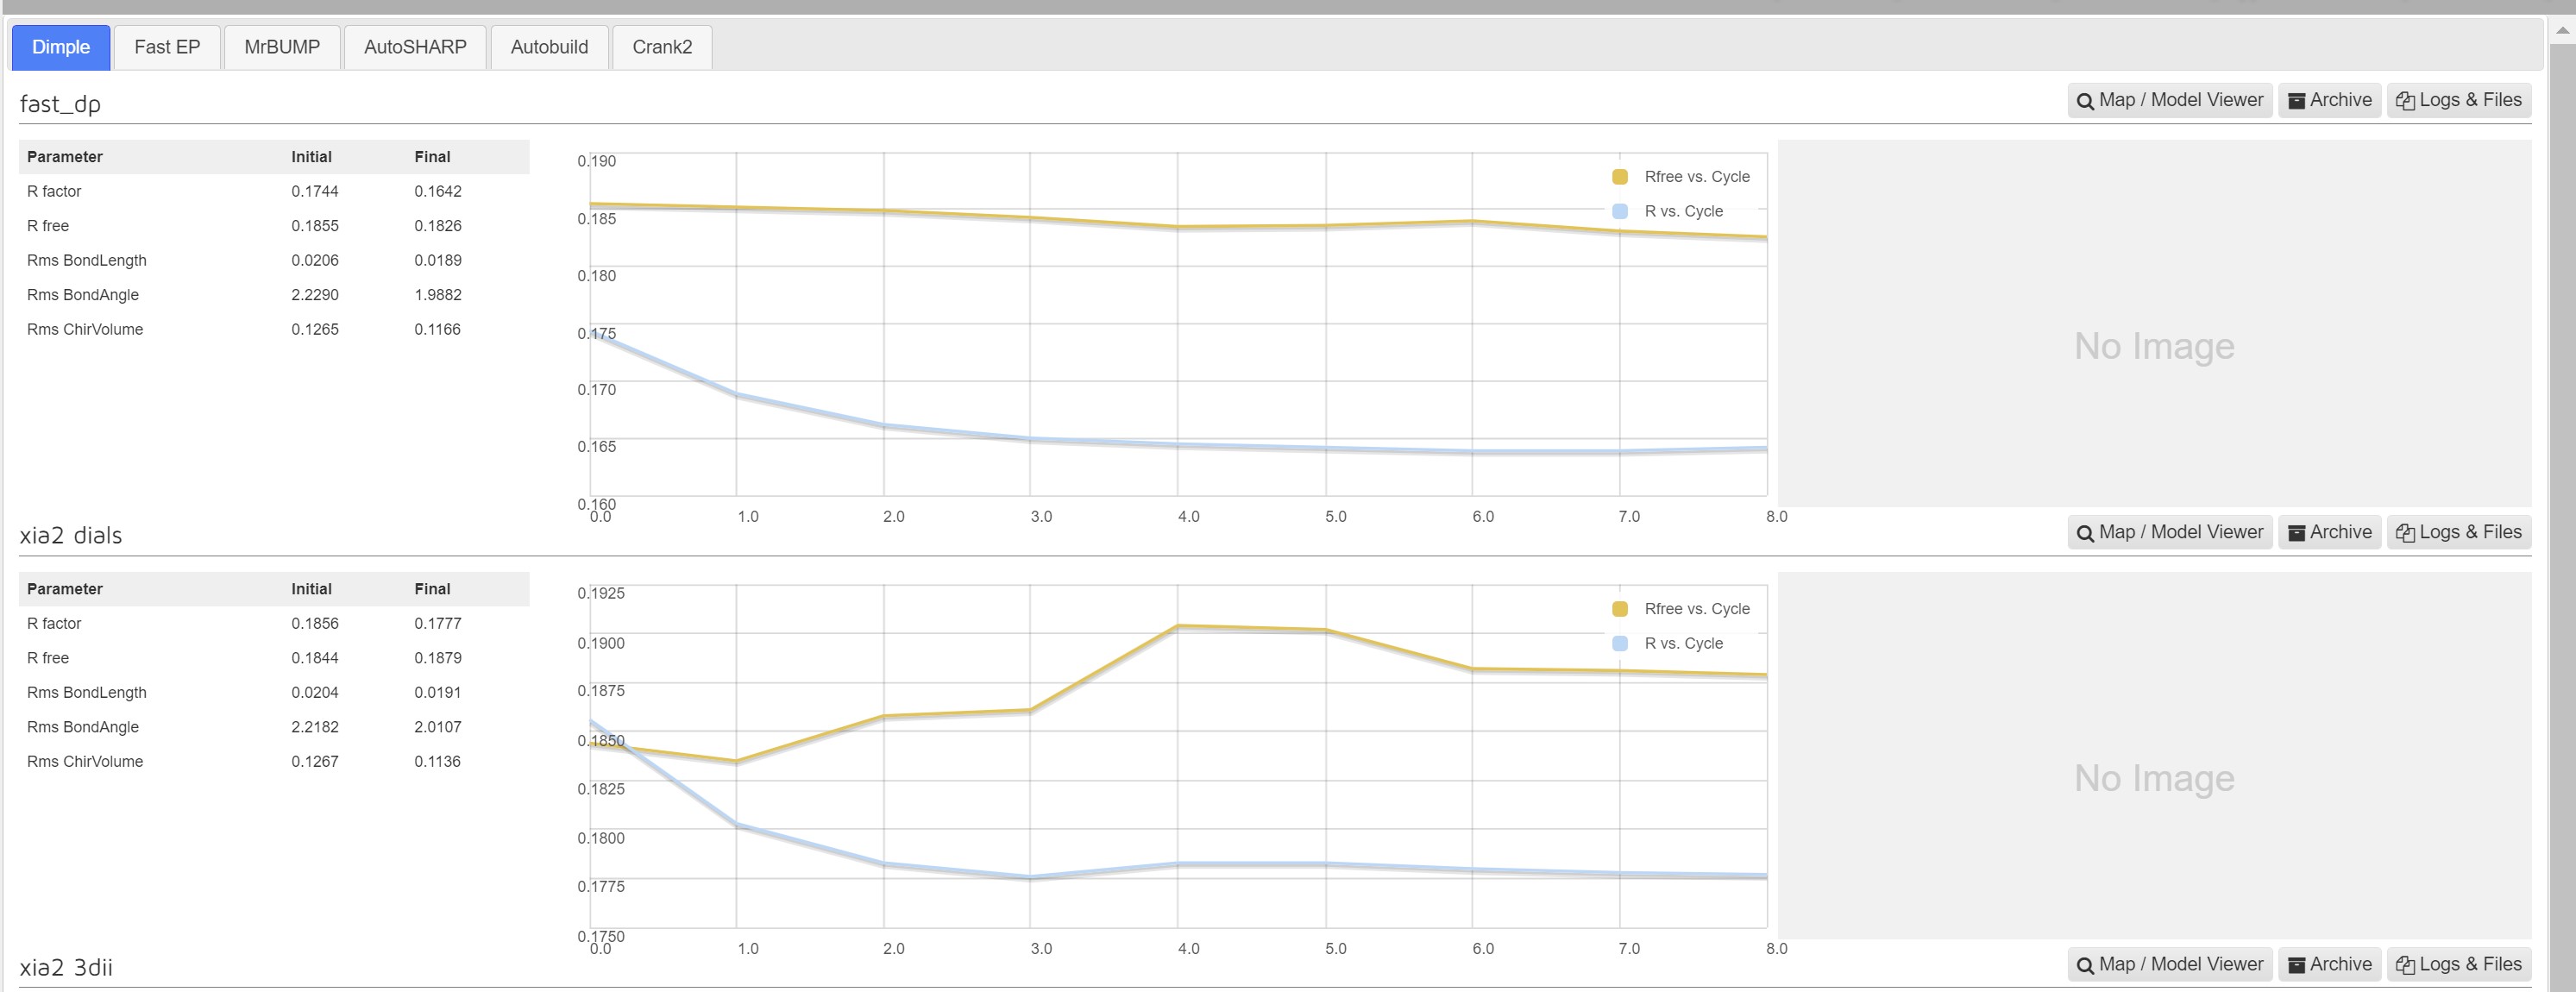
Dimple
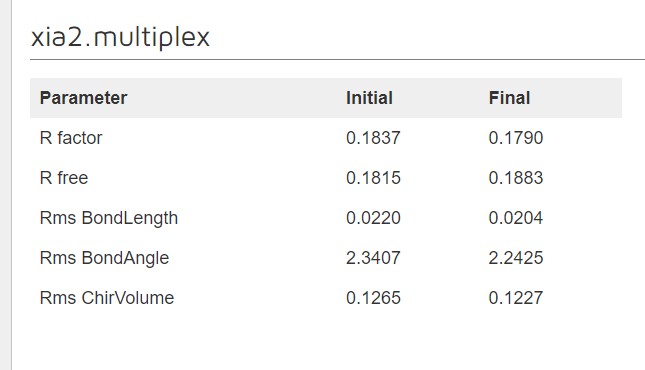
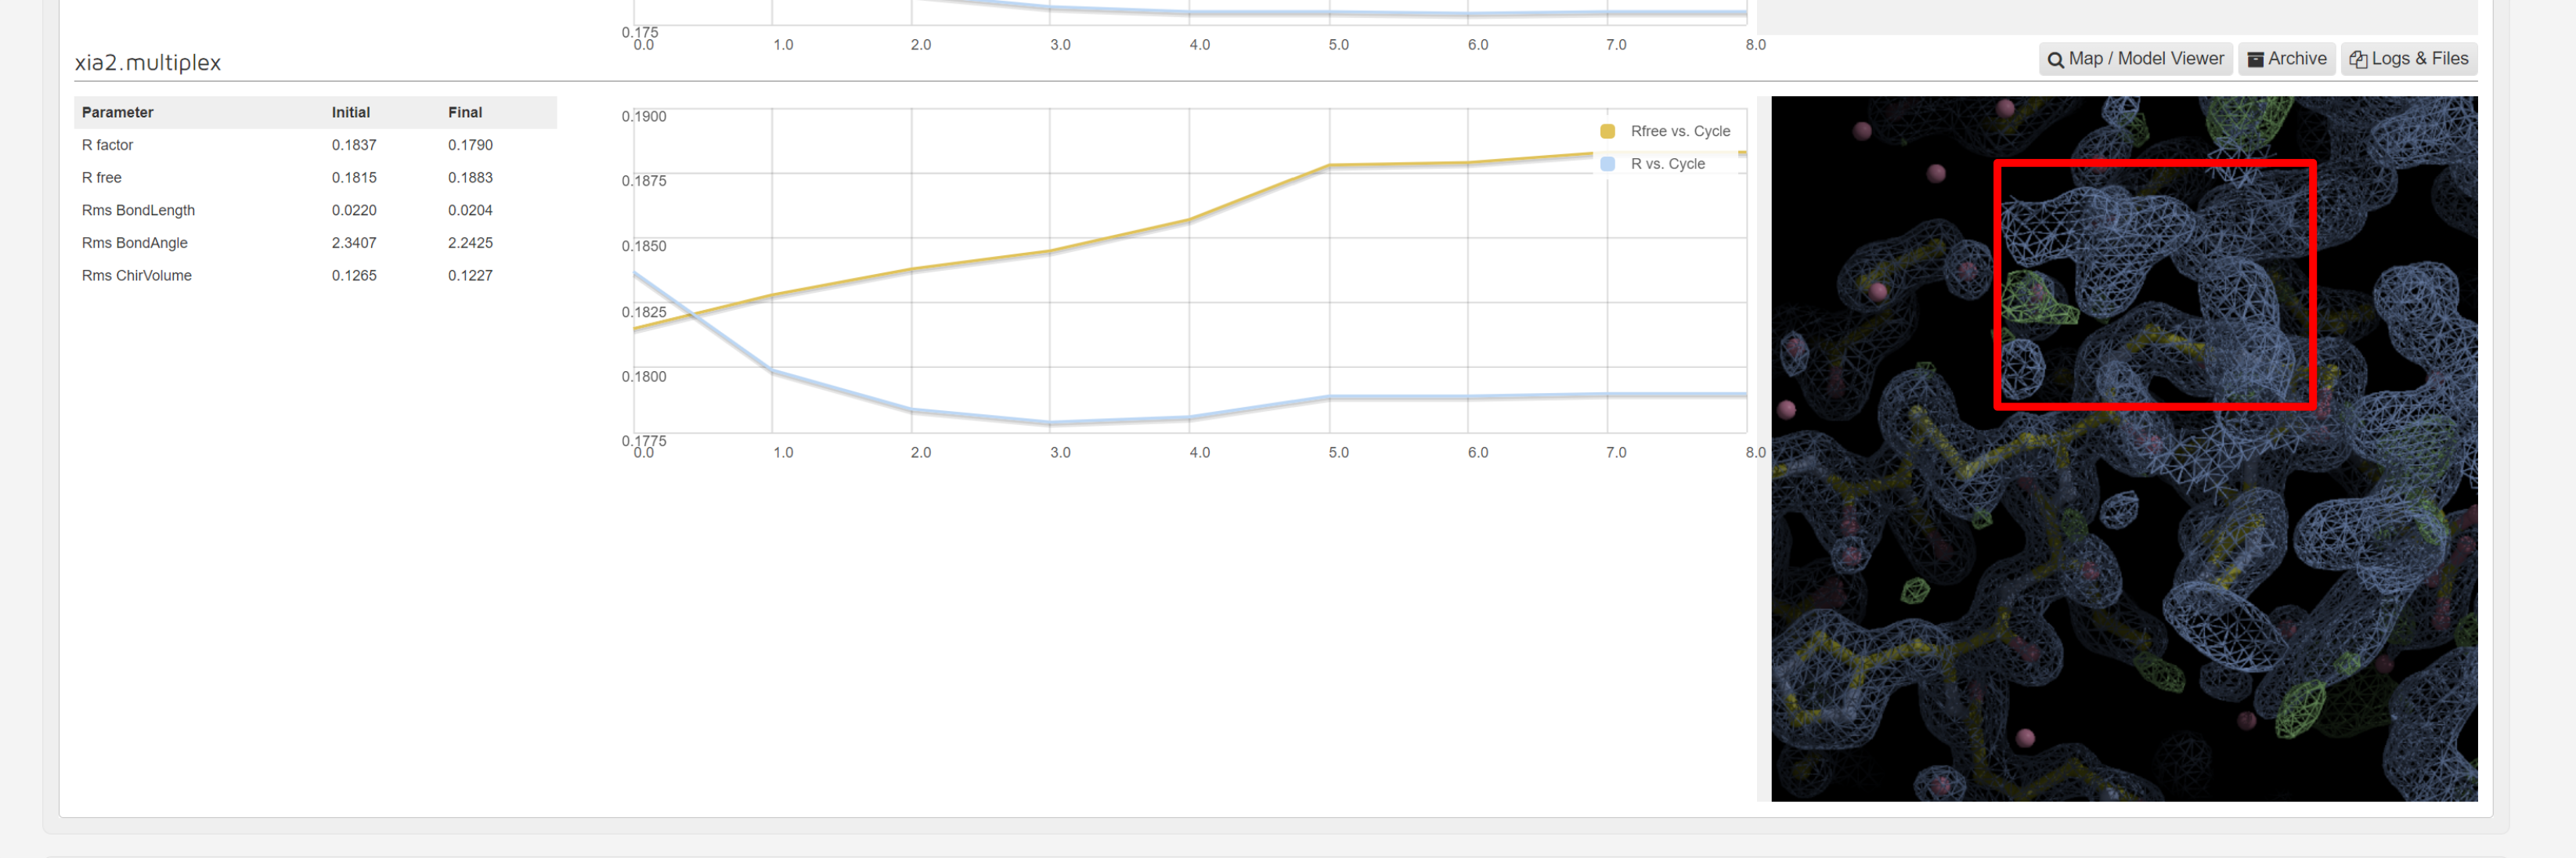
Dimple processes, if successful, will show a table indicating the initial and final refinement statistics:
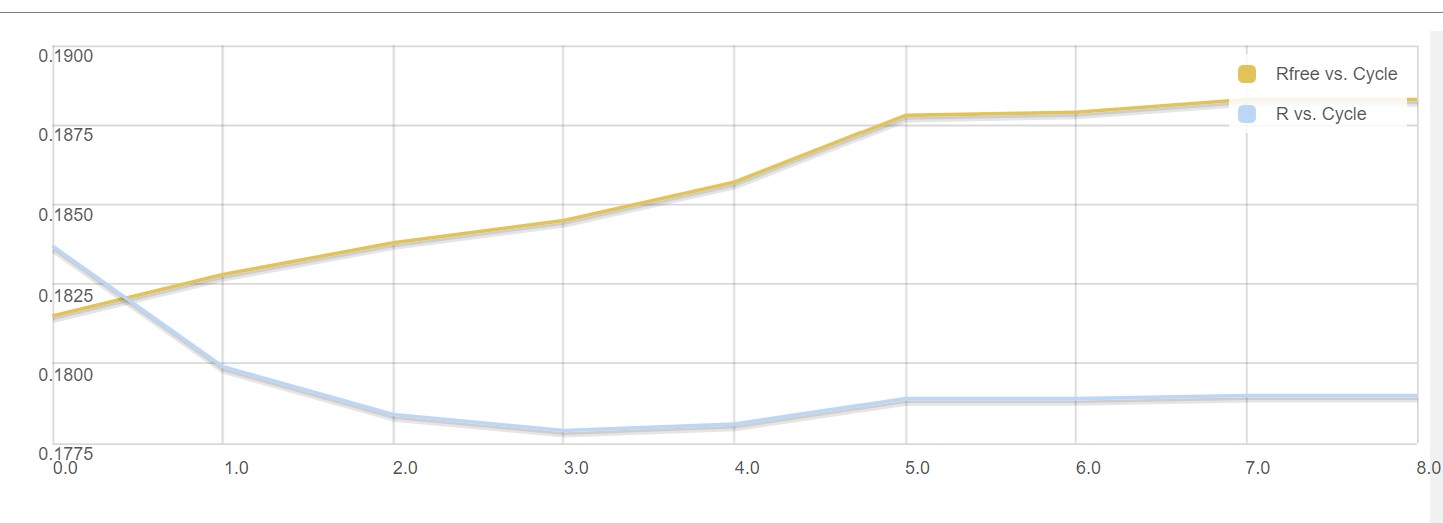
A graph showing the change in R factors over the refinement cycles:
As dimple will generate a difference density map pointing to unmodelled electron density blobs – potential ligand sites. When a unmodelled blob is found, the interface shows the first unmodelled blob within a rendered image:
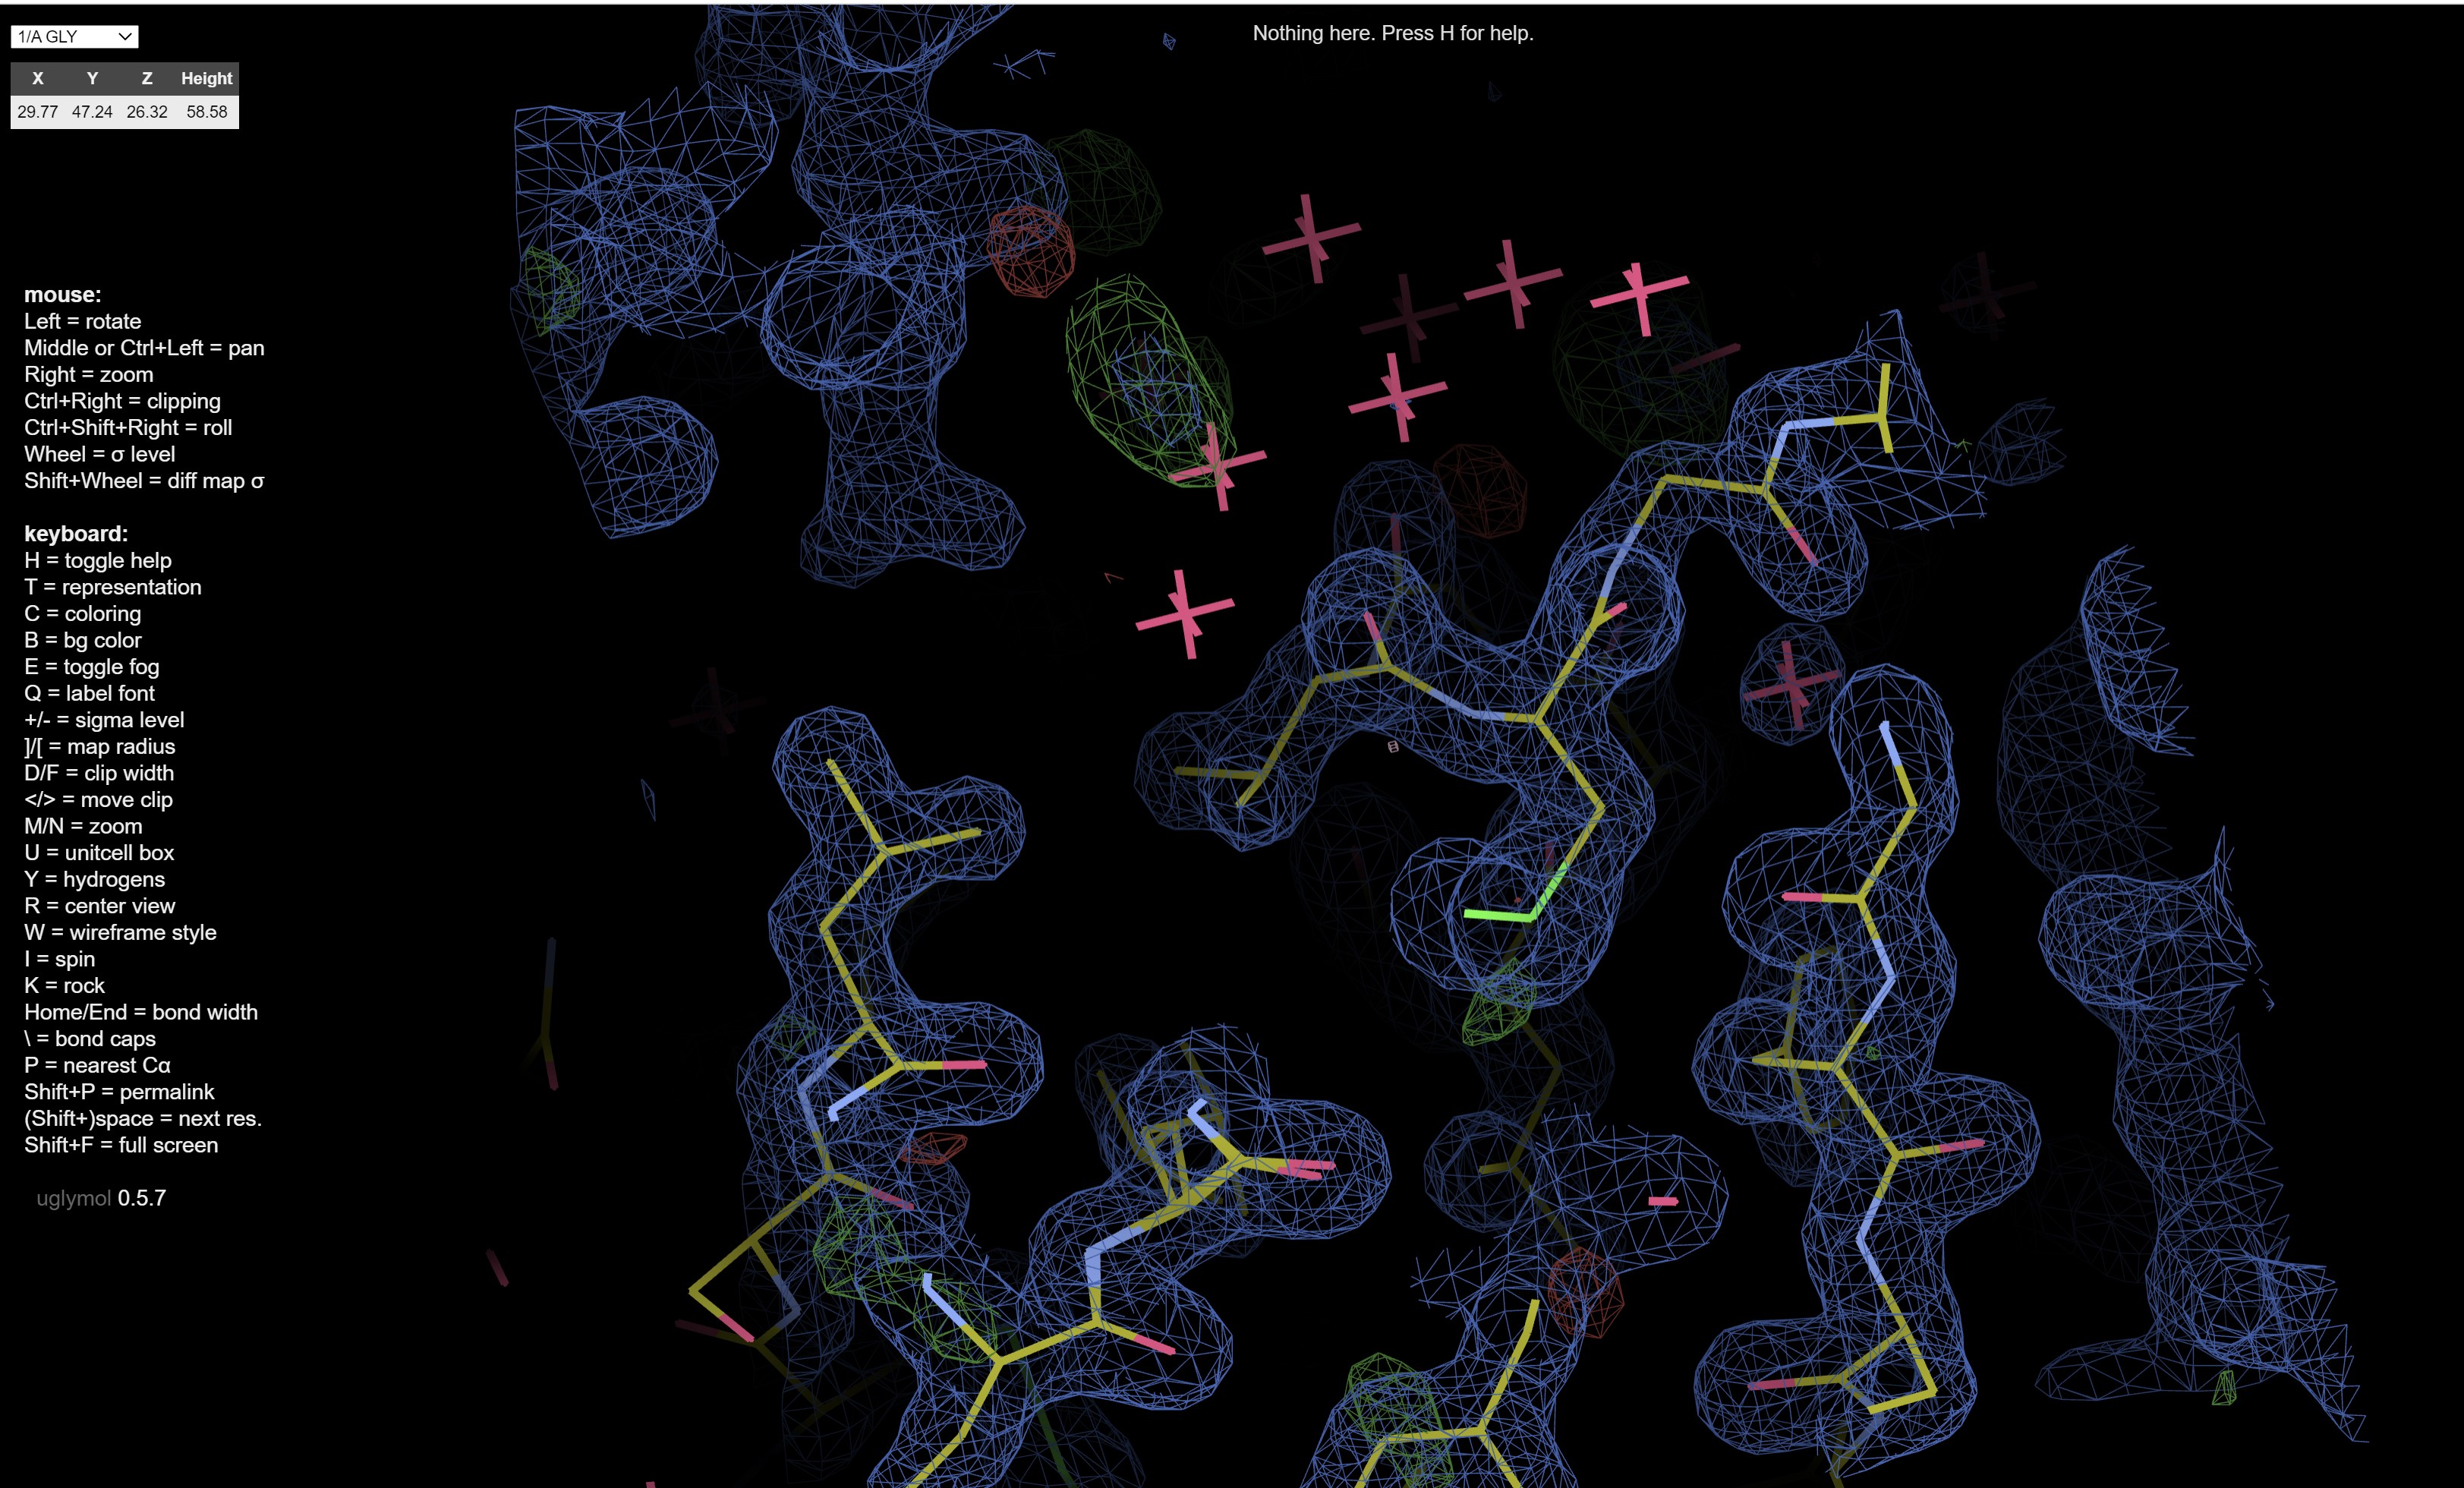
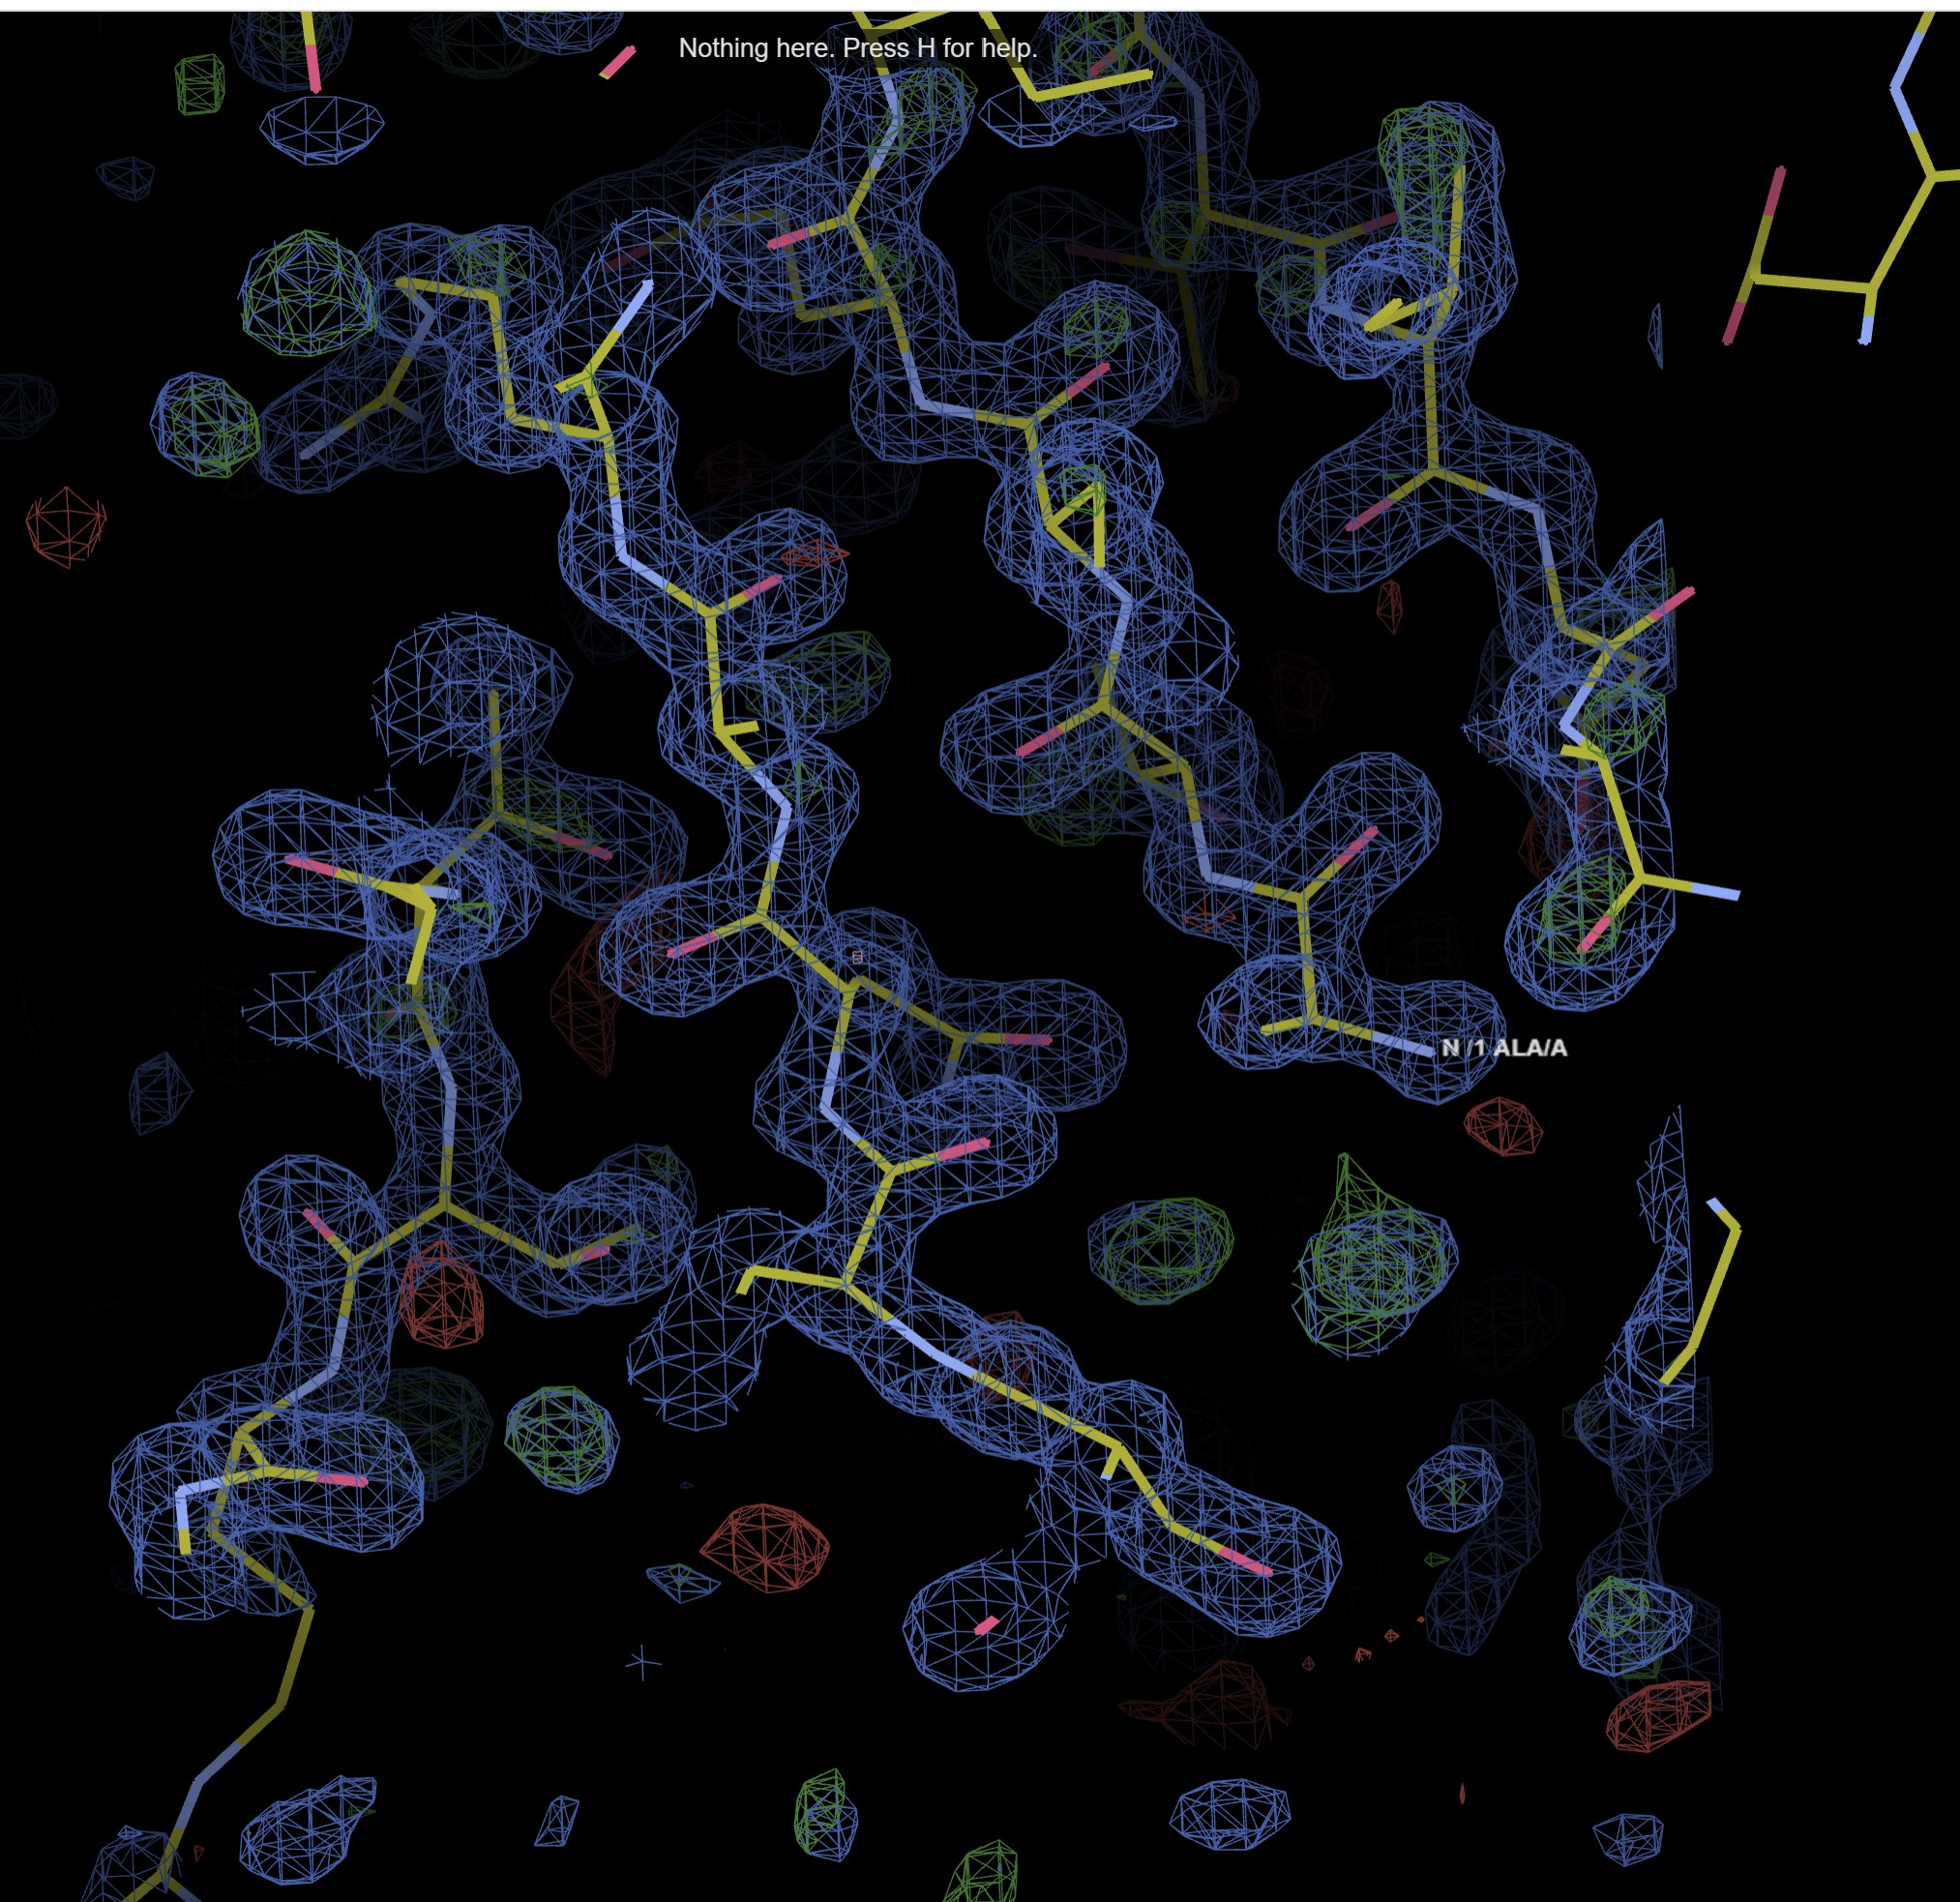
There is a map and model viewer using UglyMol is accessed via the button:
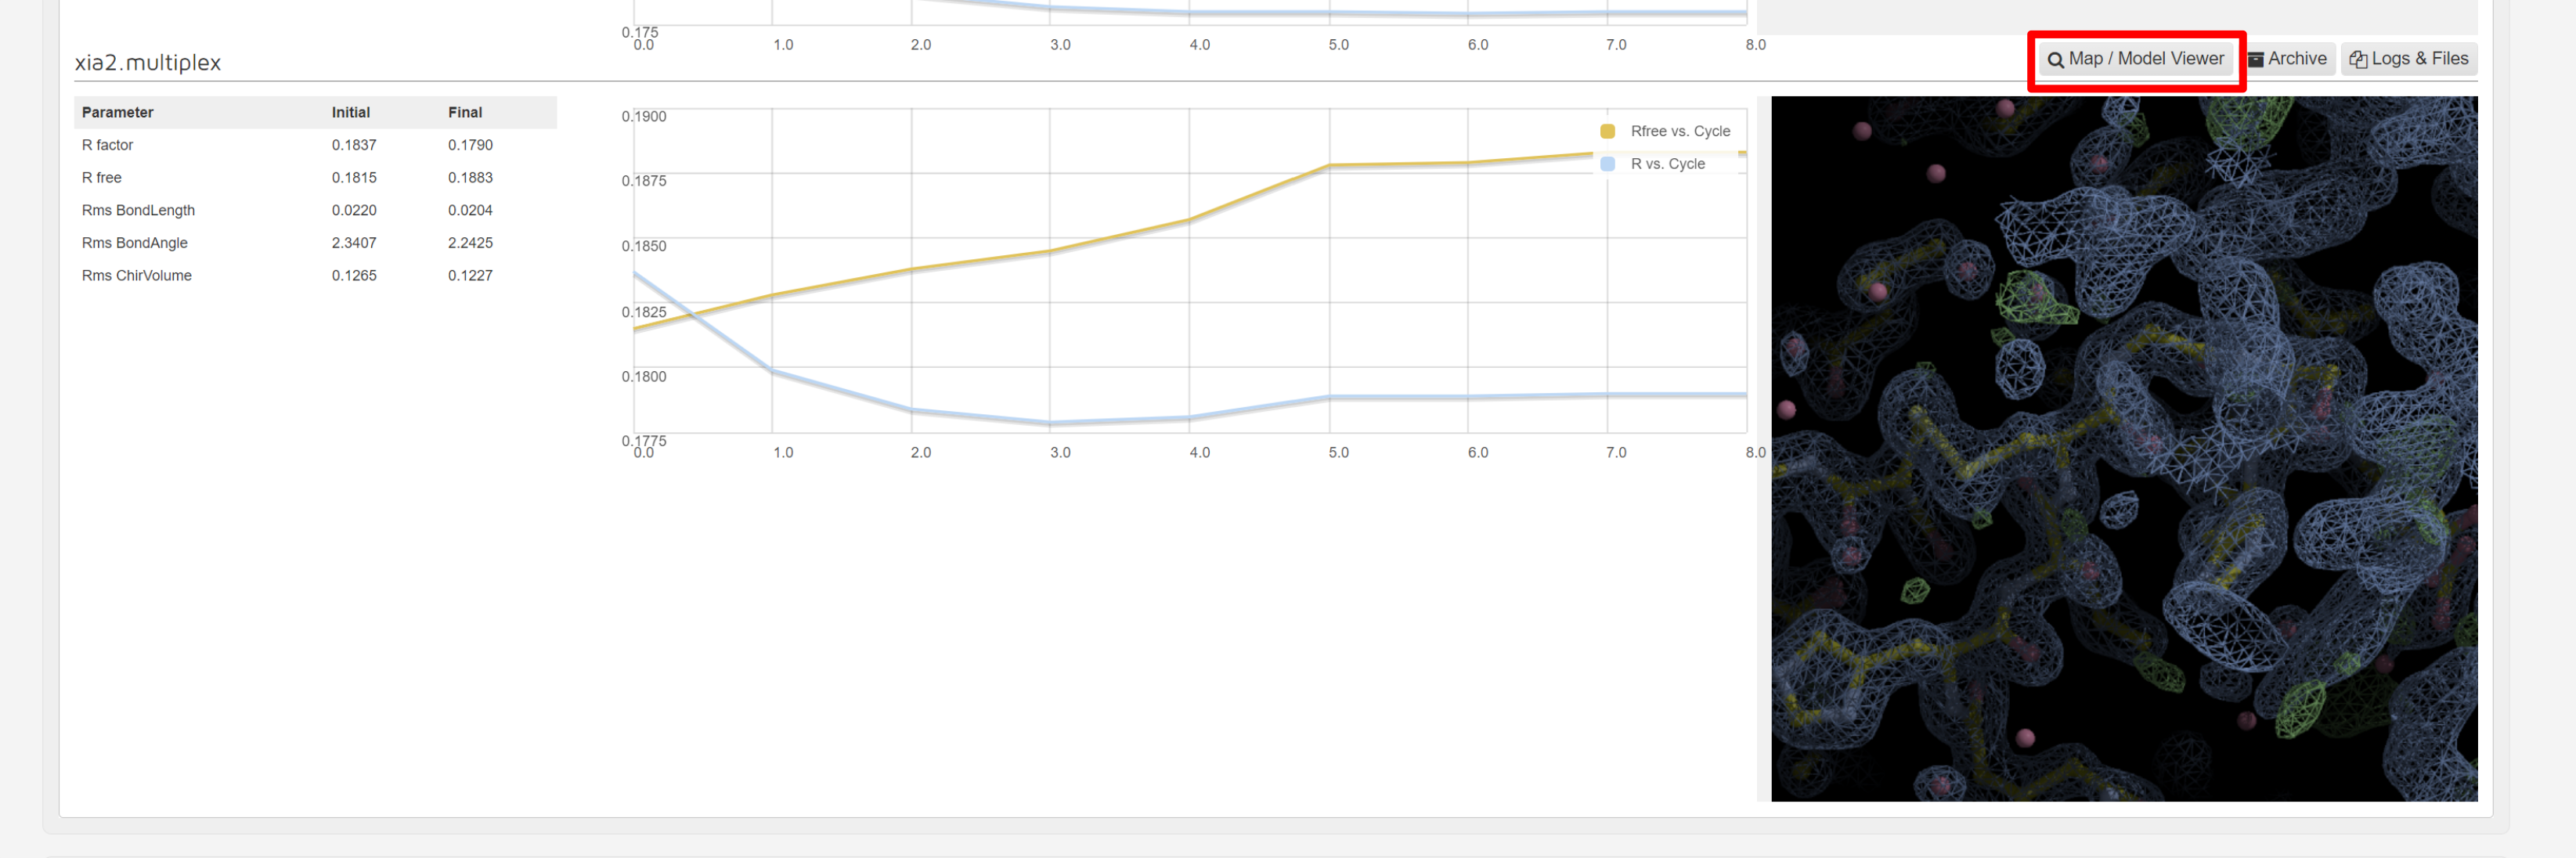
which shows electron density maps and the fitted model:
The logs and files, and archive buttons give you the ability to download the results from the dimple run.
Citation
Also remember to cite the appropriate publication for the autoprocessing pipeline used prior to Dimple, and the programs which dimple calls (i.e. Refmac5).
Wojdyr, M., Keegan, R., Winter, G., Ashton, A. (2013) DIMPLE - a pipeline for the rapid generation of difference maps from protein crystals with putatively bound ligands. Acta Cryst. A69: s299
Fast EP
Fast EP is a experimental phasing pipeline run when an anomalous scatterer is defined, and is designed to quickly determine the feasibility of experimental phasing from the current data collection, to help inform ongoing data collection during an experiment.
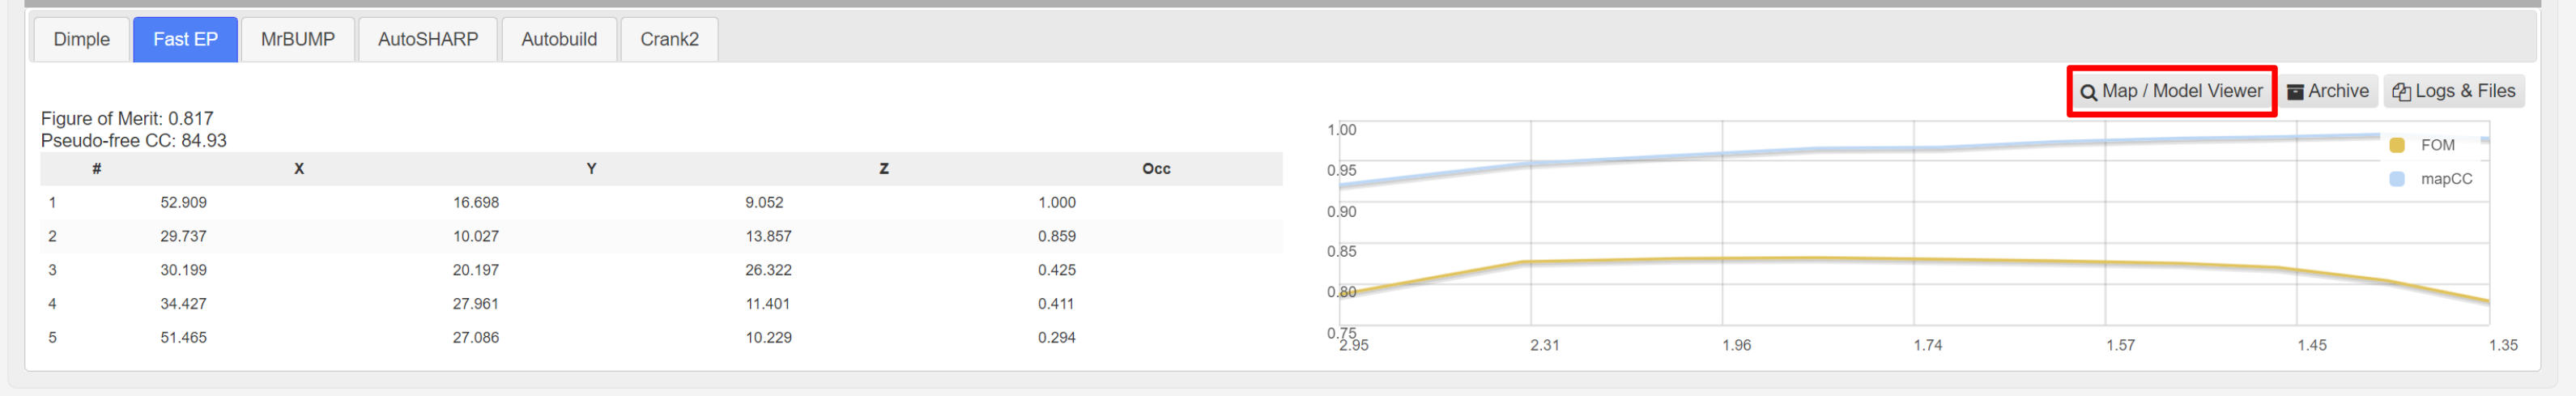
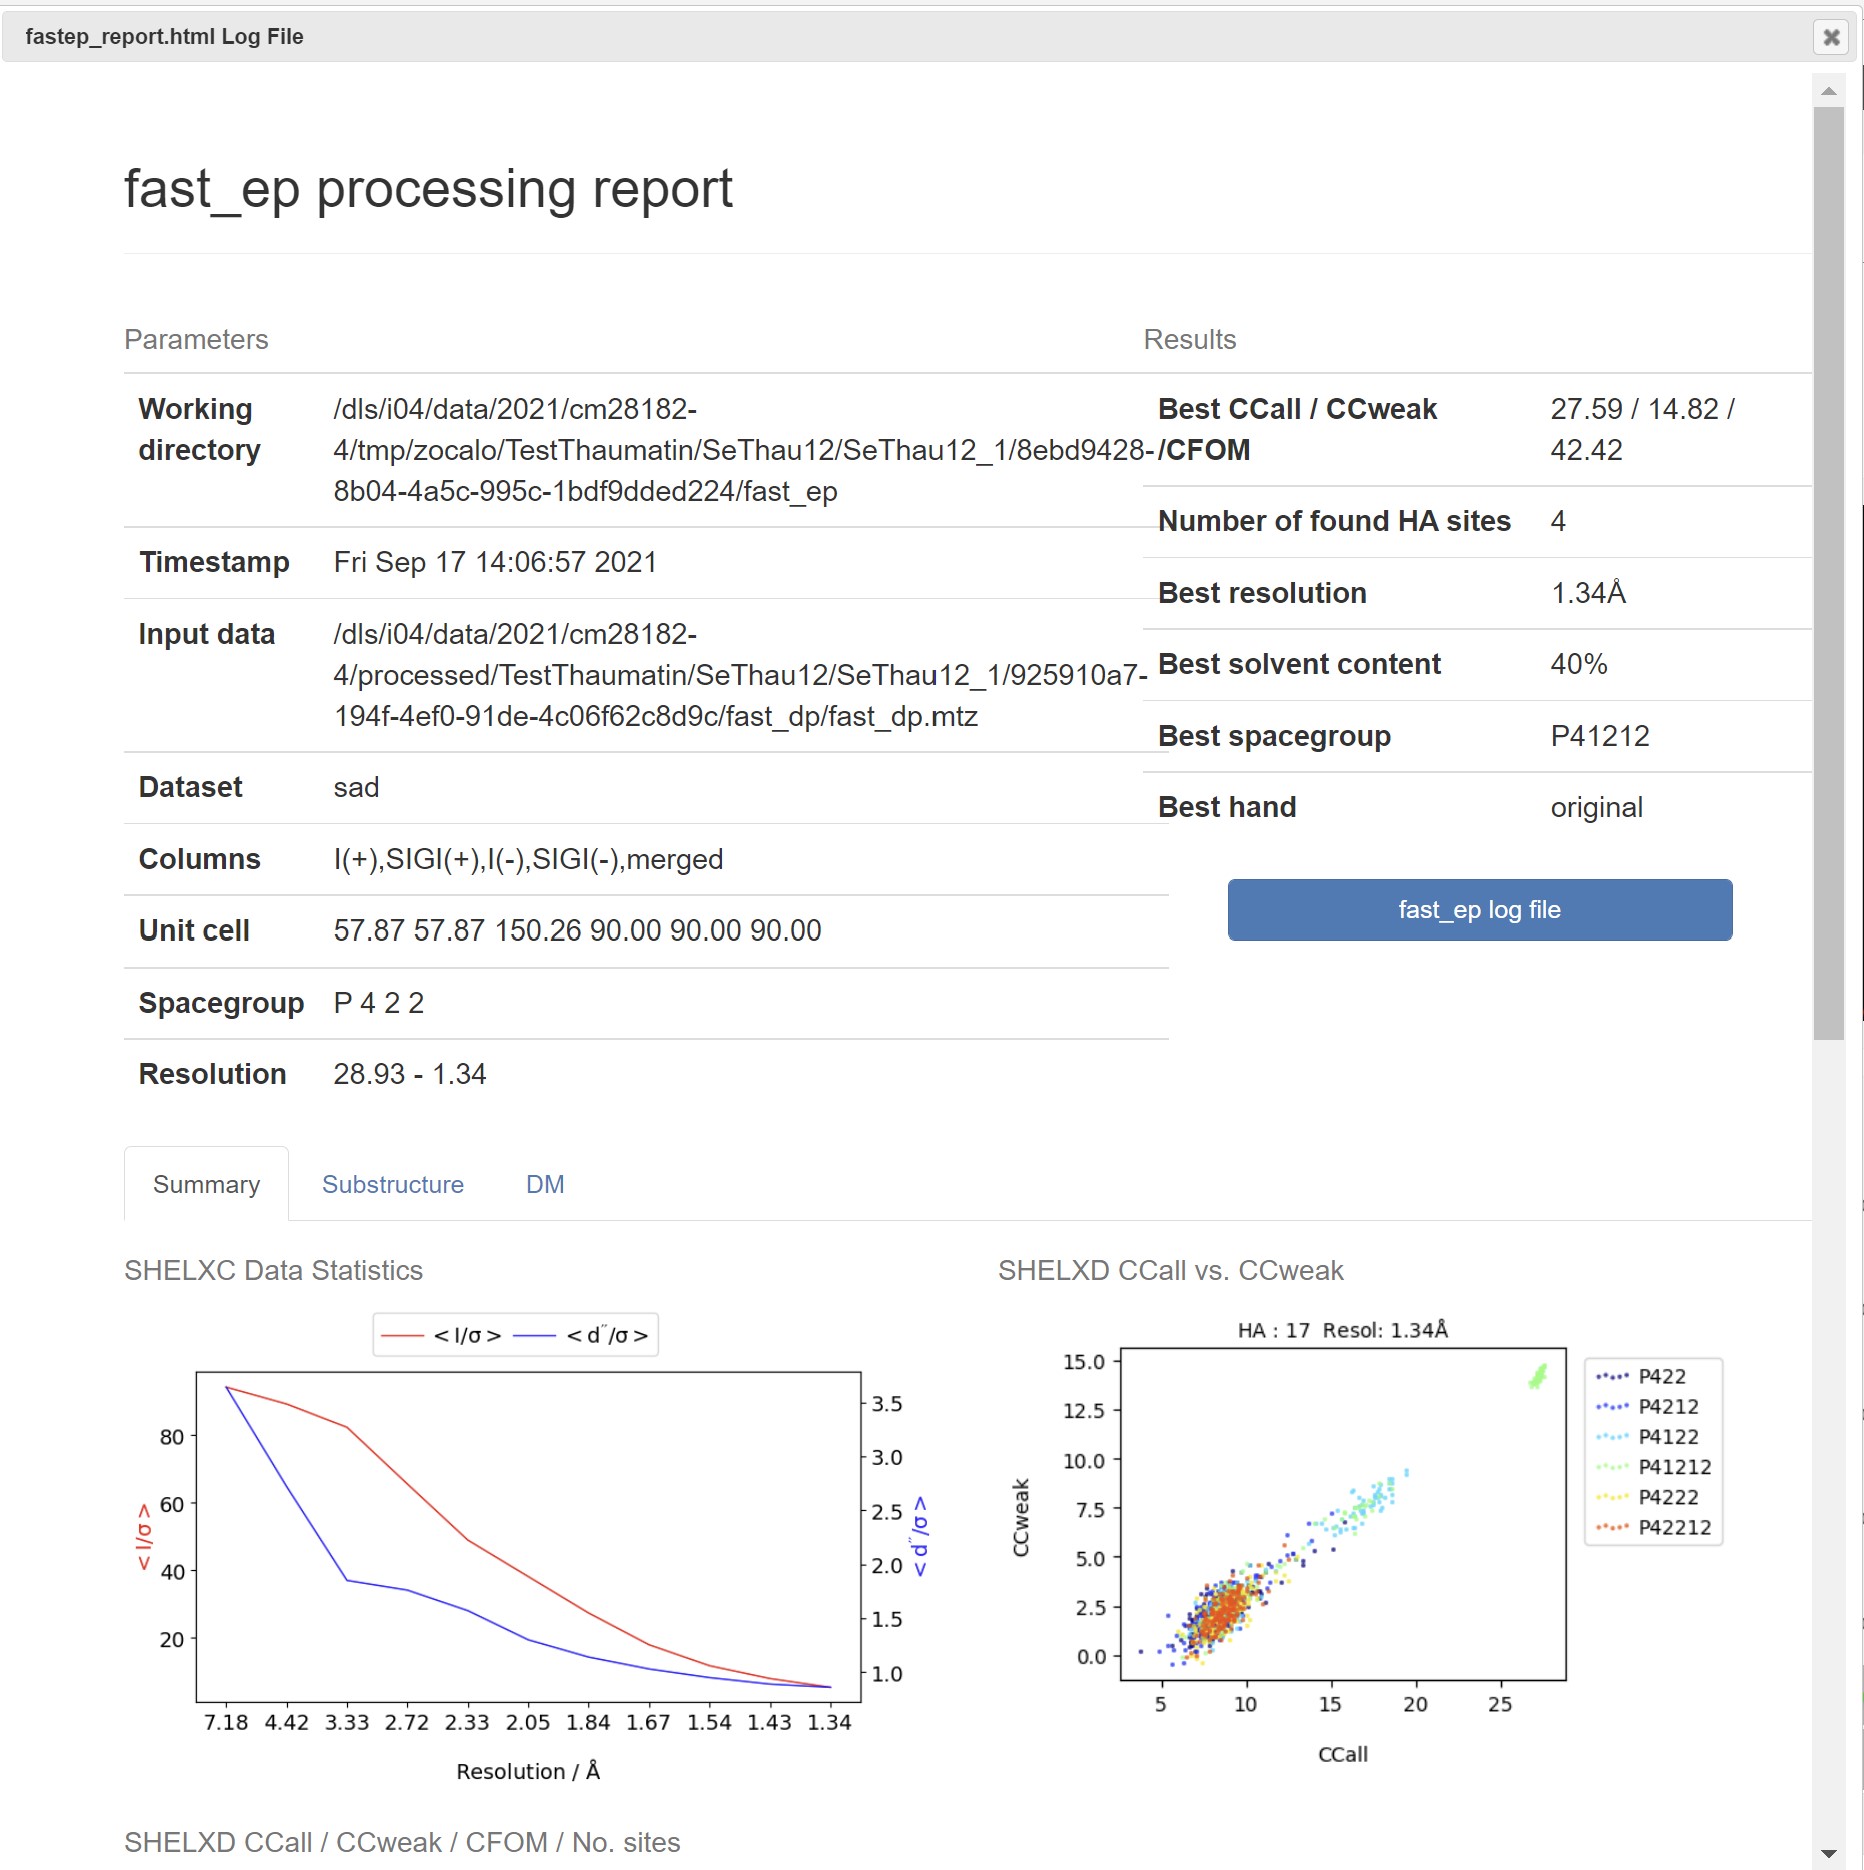
In downstream processing the Fast EP results are presented with a summary table of the heavy atom sites:
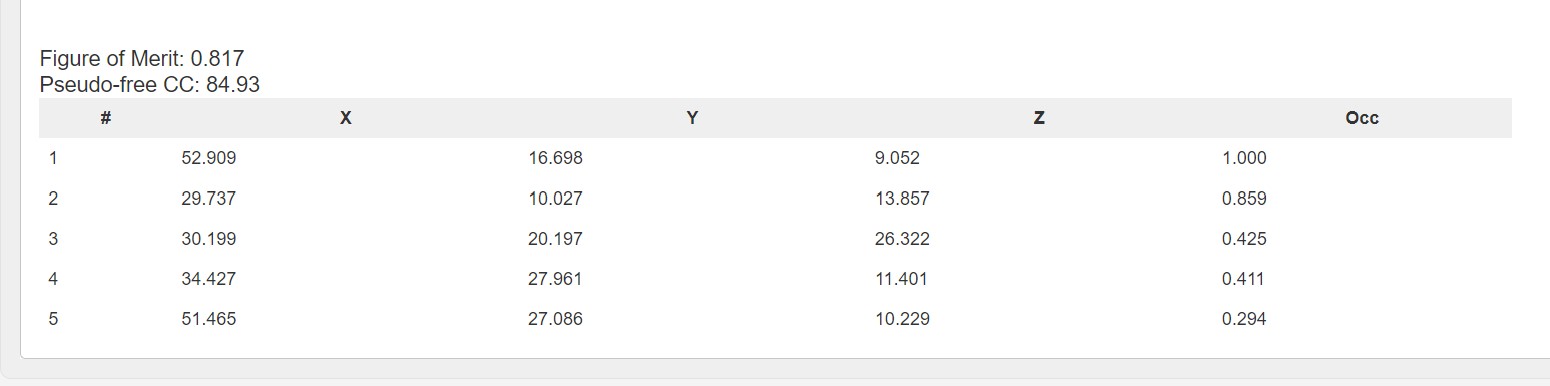
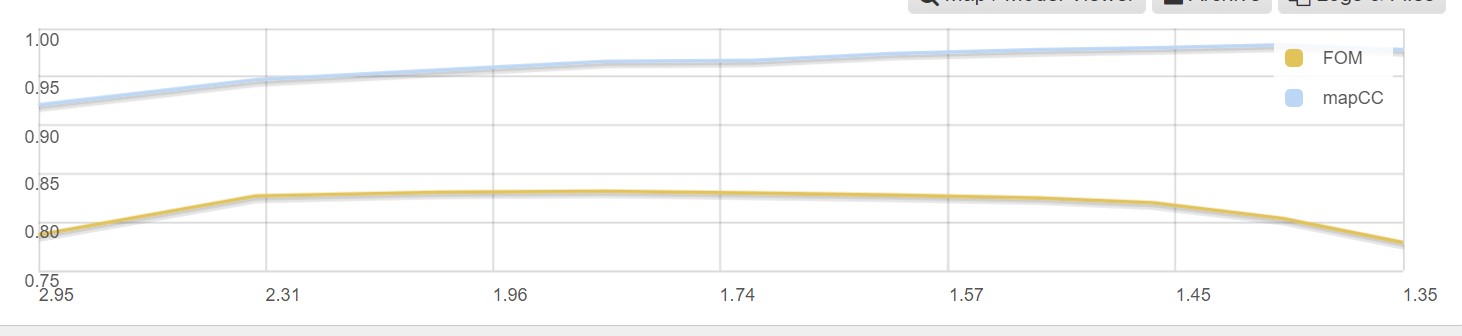
As well as a graph showing the map correlation coefficent and the figure of merit versus the dataset resolution:
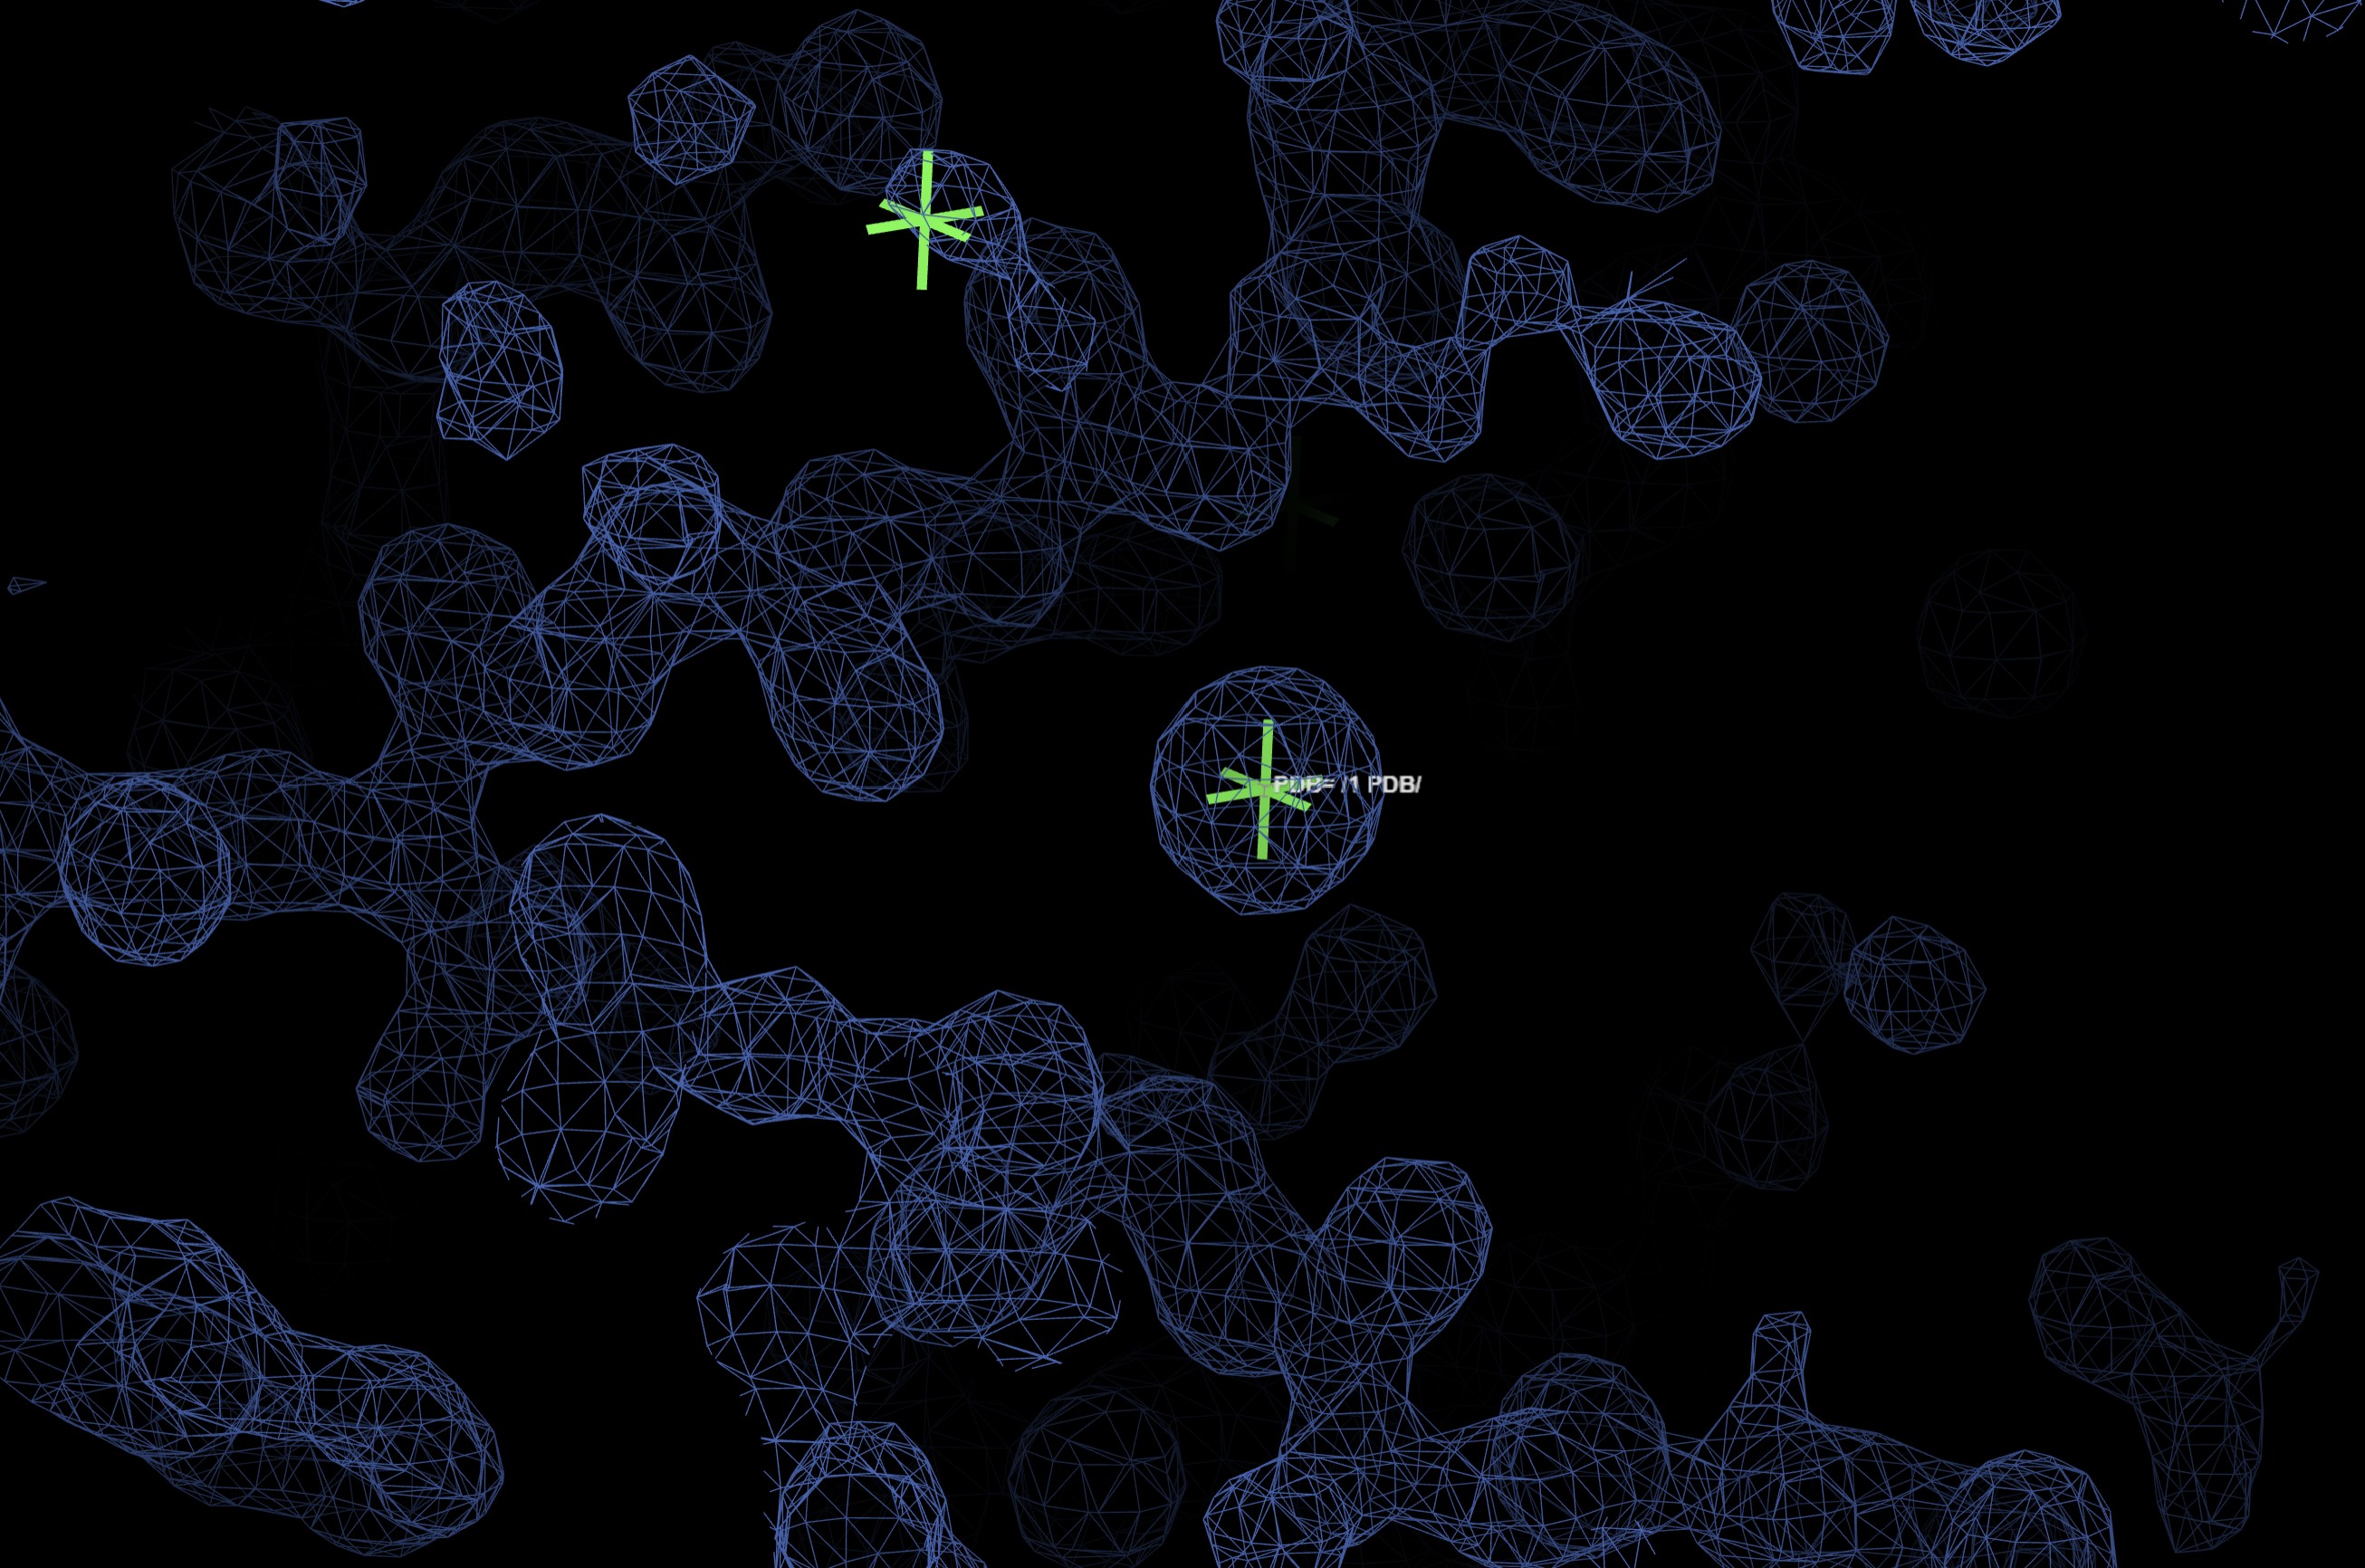
The found heavy atoms can be seen in an UglyMol winow by selecting the Map/Model viewer:
Showing:
A summary html can be found in the Logs and Files for Fast EP:
MrBump
MrBUMP is undertakes automated search model generation and automated molecular replacement. It requires a sequence or sequence and PDB model to be provided within ispyb prior to data collection.
MrBUMP has three main parts:
-
For a given target sequence, automated discovery of chains, domains and multimers that are possible templates for molecular replacement search models
-
Preparation of actual search models using a variety of structure editing techniques
-
Running molecular replacement using these search models and testing whether the resulting solutions will refine.
Within Downstream processing interface the MrBump results are presented with a graph of R factor and RFree versus number of cycles for each autoprocessing pipeline:
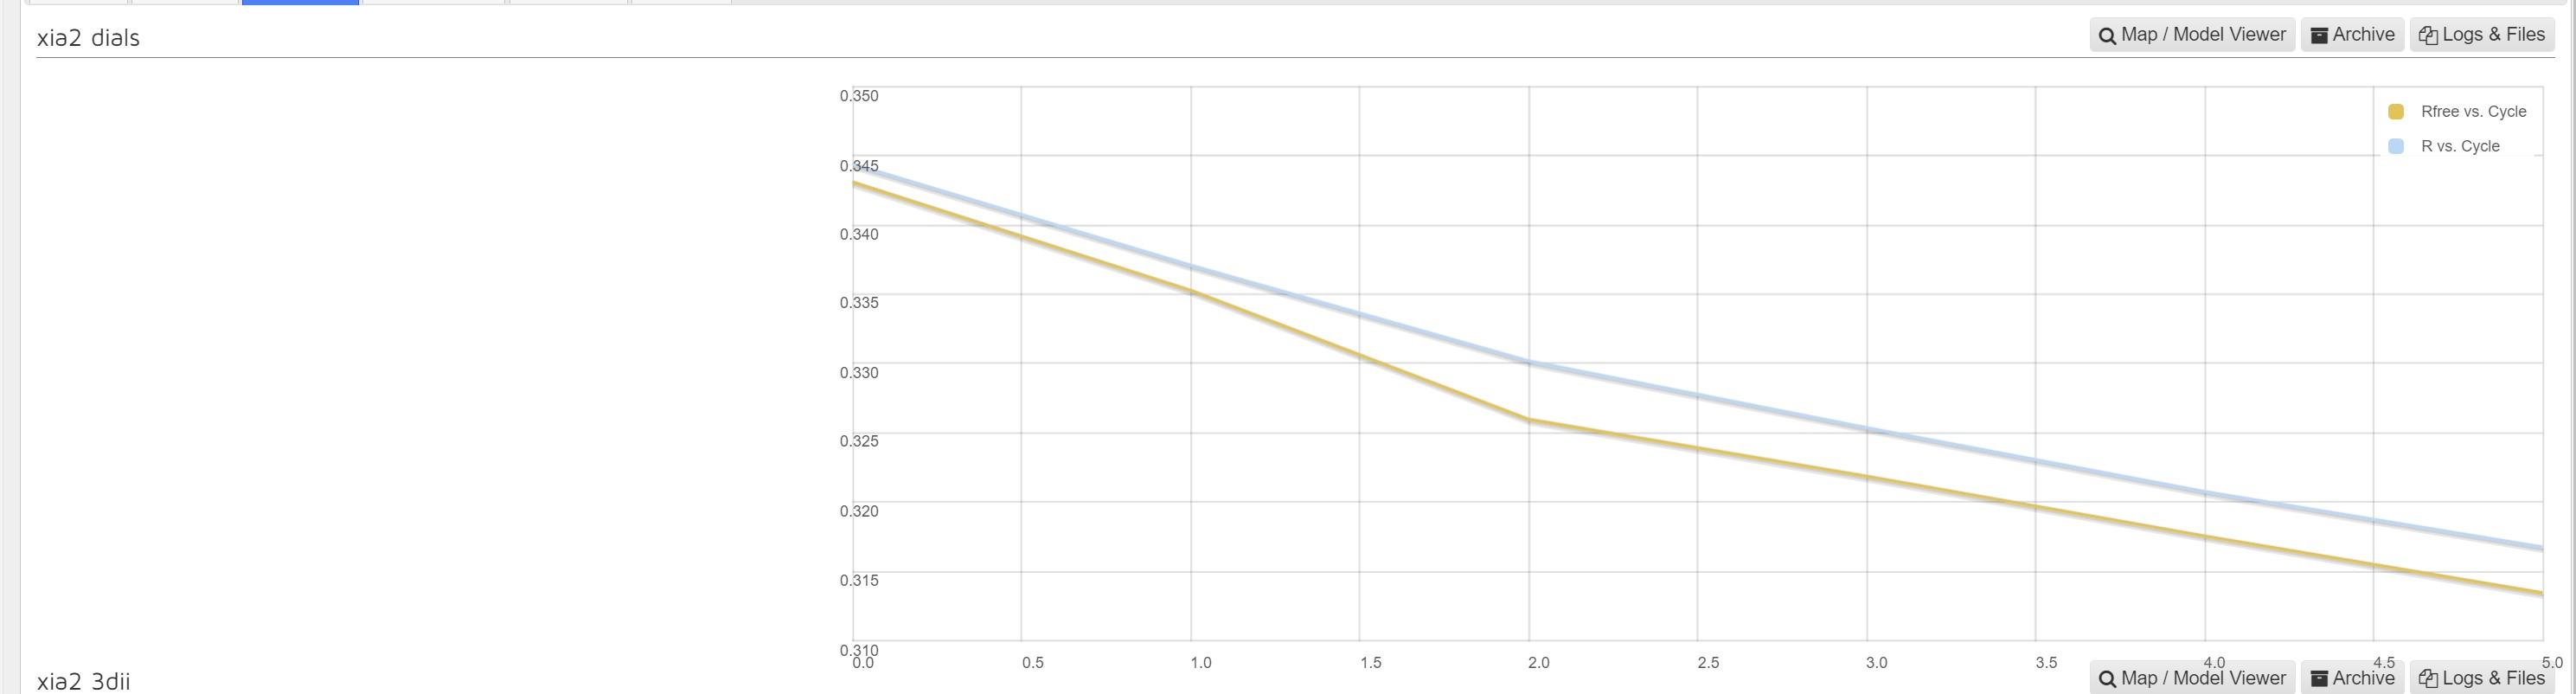
The map and model viewer button you takes to a UglyMol viewer of the built model.
Citation
Any publication arising from use of MrBUMP should include the following reference:
R.M.Keegan and M.D.Winn (2007) Acta Cryst. D63, 447-457
See the documentation for a full list of consutient programs which may also require citation.
autoSHARP
autoSHARP is a tool for experimental phasing including SAD, MAD, MIRAS and SIRAS developed by Global Phasing. Its use at Diamond is subject to academic license. When run automatically as downstream processing at diamond, a sequnce and anomalous scatter need to be provided. The pipeline will attempt to phase, find a substructure, density modify and automatically build a model into the resutlant electron density.
A wide set of examples and tutorials and manual are available from global phasing.
In the downstream processing panel for the results of each autoprocessing pipeline:
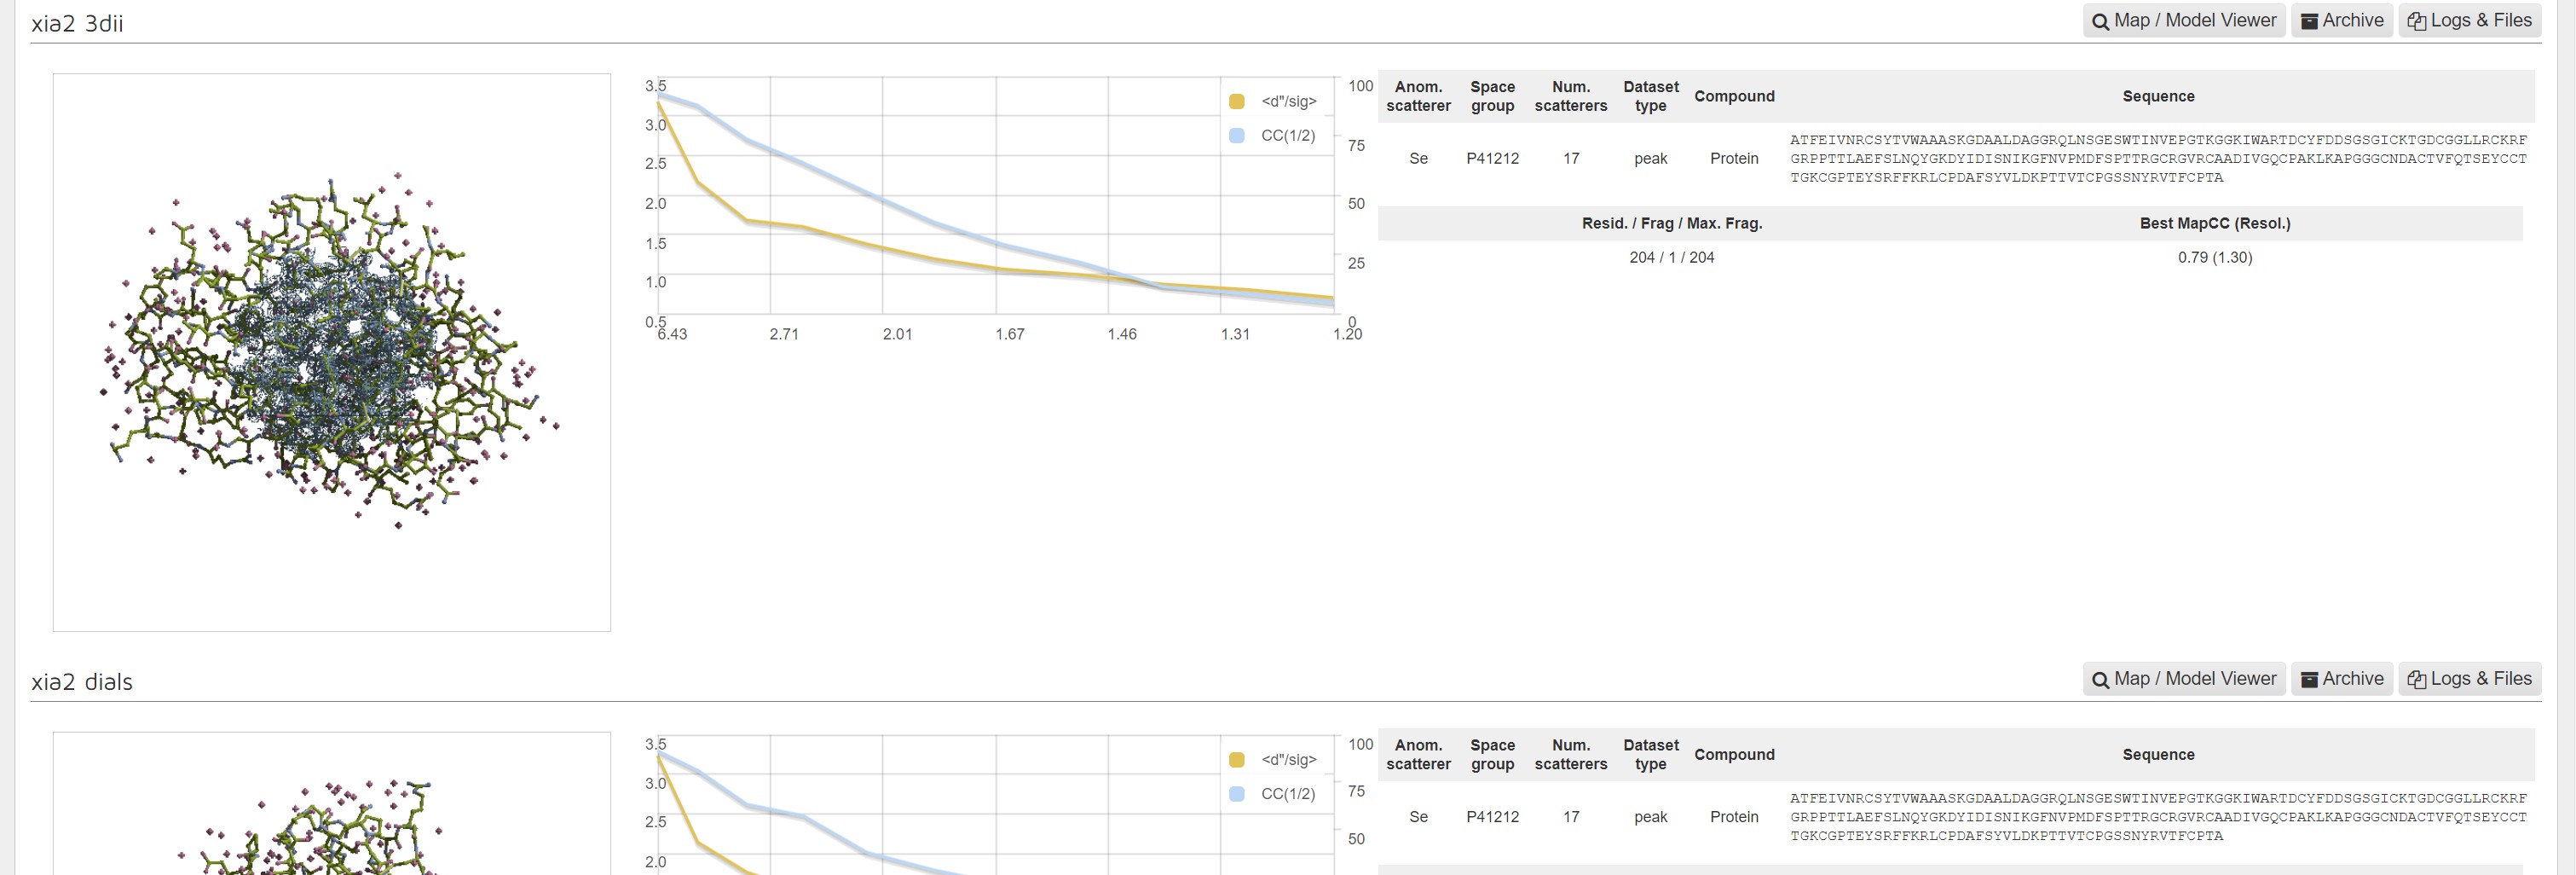
There is a image showing the whole model:
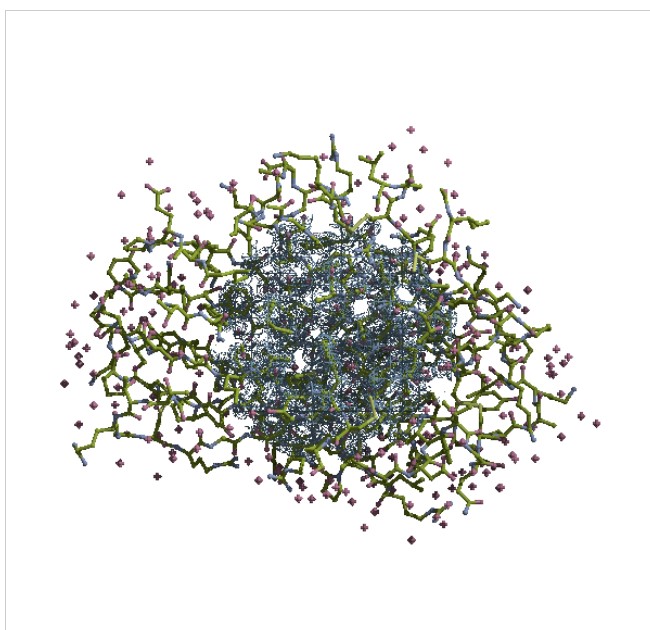
A graph showing CC1/2 and <d"/σ> versus resolution:
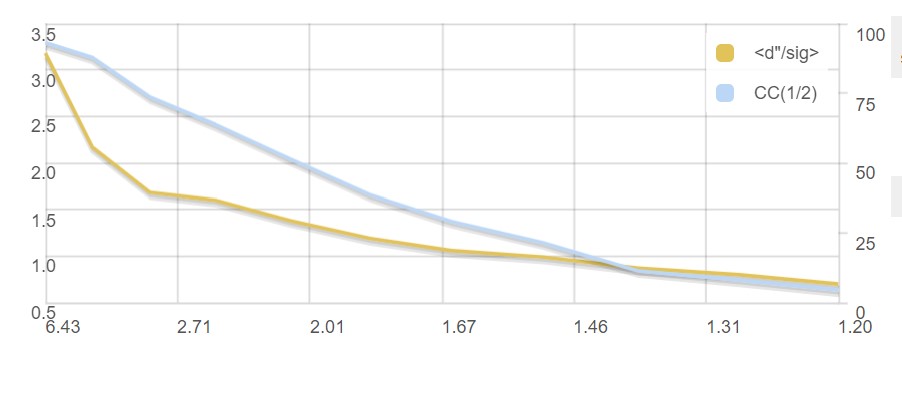
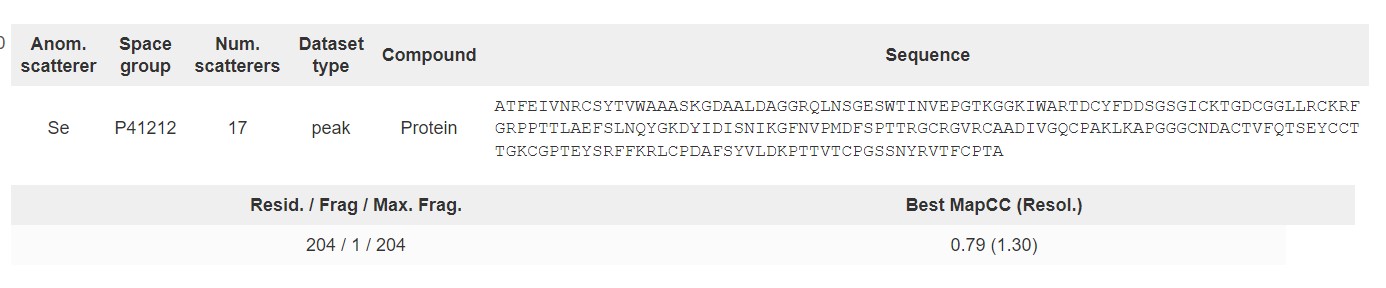
and a summary of inputs and results.
Through the Logs and Files interface a summary html of the autoSHARP process is available:
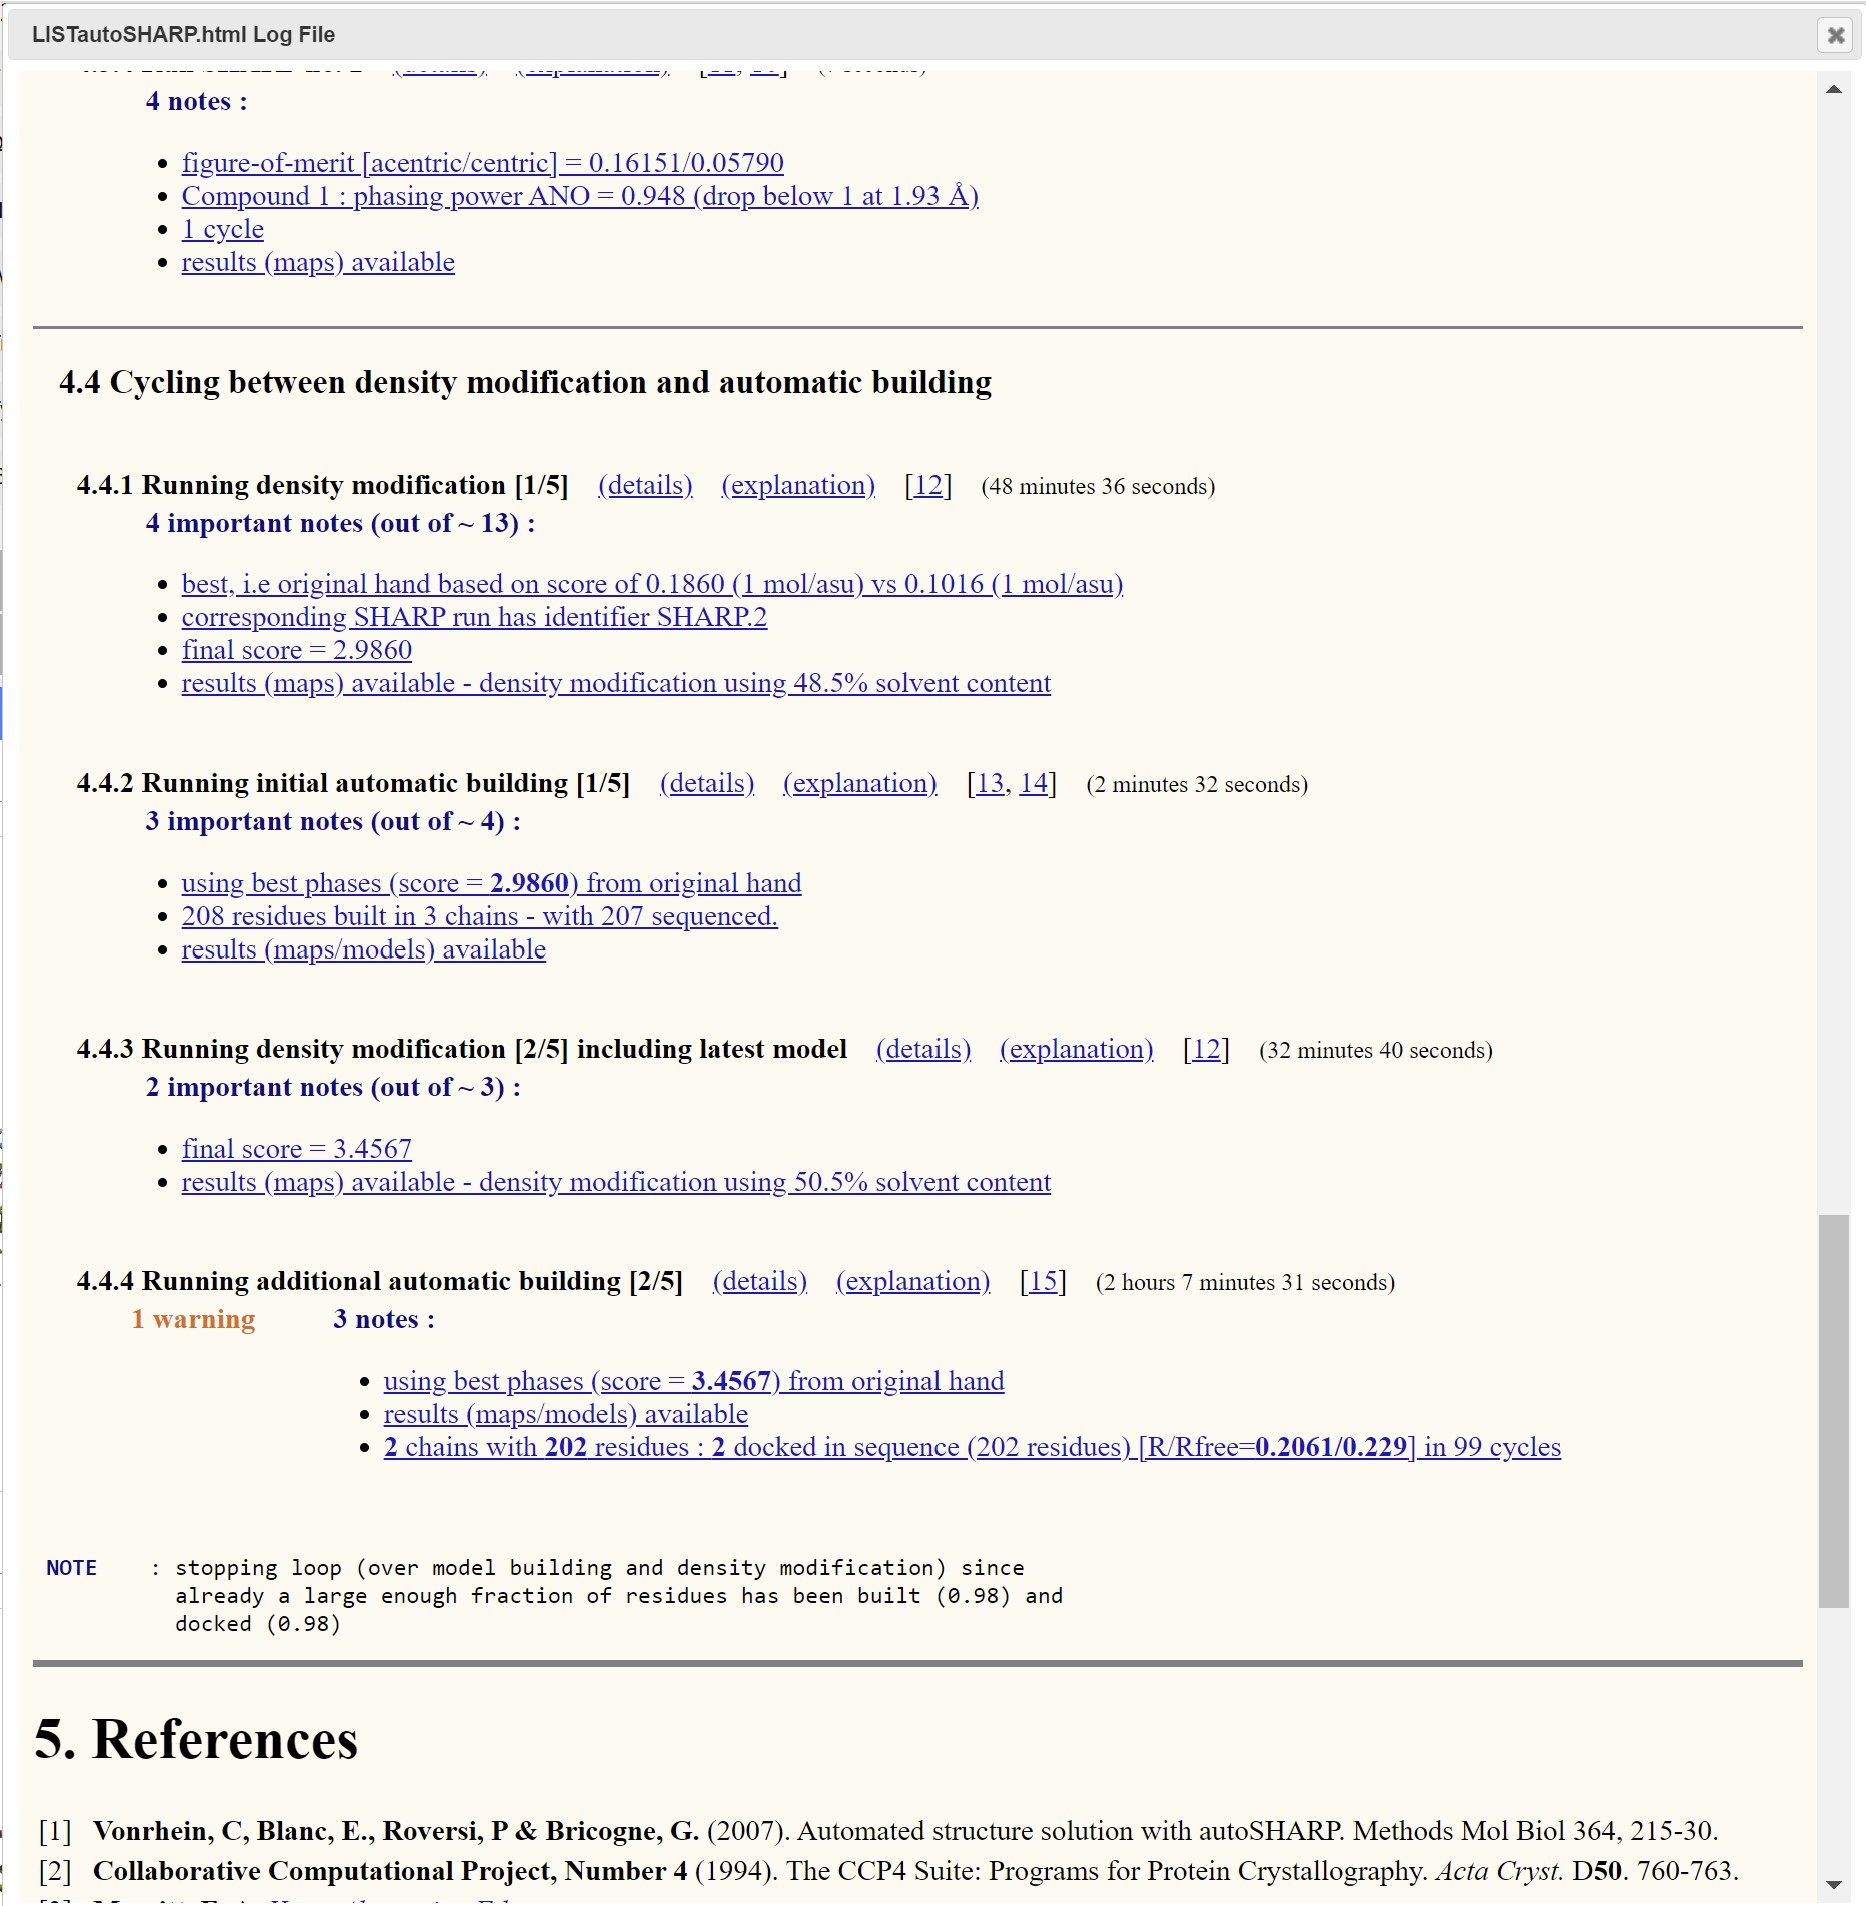
This is a good place to determine if the result of the autoSHARP process has produced a viable or optimal results. There is also a map and model viewer where the structure can be viewed.
Citations
Please refer to Citations on autoSHARP website, shown below. Also remember to cite the appropriate publication for the autoprocessing pipeline used prior to autoSHARP.
- SHARP
Bricogne, G., Vonrhein, C., Flensburg, C., Schiltz, M. & Paciorek, W. (2003). Generation, representation and flow of phase information in structure determination: recent developments in and around SHARP 2.0. Acta Cryst. D59, 2023-2030. (PDF)
- autoSHARP
C. Vonrhein, E. Blanc, P. Roversi & G. Bricogne (2007). Automated structure solution with autoSHARP. Methods Mol Biol 364, 215-30. (Link)
Autobuild
Autobuild shows the results of phenix.autobuild run on each of the autoprocessing pipeline. The summary information shown is the same above for autoSHARP.
Citations
It may also be necessary to cite some of those listed in the set of phenix related papers. Also remember to cite the appropriate publication for the autoprocessing pipeline used prior to phenix.autobuild.
- Main phenix paper
Macromolecular structure determination using X-rays, neutrons and electrons: recent developments in Phenix. D. Liebschner, P.V. Afonine, M.L. Baker, G. Bunkóczi, V.B. Chen, T.I. Croll, B. Hintze, L.W. Hung, S. Jain, A.J. McCoy, N.W. Moriarty, R.D. Oeffner, B.K. Poon, M.G. Prisant, R.J. Read, J.S. Richardson, D.C. Richardson, M.D. Sammito, O.V. Sobolev, D.H. Stockwell, T.C. Terwilliger, A.G. Urzhumtsev, L.L. Videau, C.J. Williams, and P.D. Adams. Acta Cryst. D75, 861-877 (2019).
- Phenix autobuild
Iterative model building, structure refinement and density modification with the PHENIX AutoBuild wizard. T.C. Terwilliger, R.W. Grosse-Kunstleve, P.V. Afonine, N.W. Moriarty, P.H. Zwart, L.-W. Hung, R.J. Read, and P.D. Adams. Acta Cryst. D64, 61-69 (2008).
Crank2
Crank2 (Paper & CCP4i2 tutorial) shows results for Crank2 run on each of the autoprocessing pipelines. The information displayed is the same as that shown for phenix.autobuild and autoSHARP.
Citation
Also remember to cite the appropriate publication for the autoprocessing pipeline used prior to Crank2
Skubák, P., Pannu, N. Automatic protein structure solution from weak X-ray data. Nat Commun 4, 2777 (2013).
