Multi-crystal experiments involve taking measurements of many different crystals of the same sample and merging them together using data reduction software (such as DIALS). Crystals that are particularly small, radiation sensitive or measured at room temperature, often cannot survive in an x-ray beam long enough to produce complete data. Sometimes, there are also sample environment constraints, such as in-situ measurements (VMXi) or the use of bespoke sample holders (VMXm) that limit the accessible rotation wedge available for each crystal. By merging multiple crystals, complete data can be achieved. Lower symmetry crystals will typically need more crystals to achieve completeness, as will samples with higher crystal-to-crystal variation. Repeated measurements can also reduce the effect of outliers, thus improving the data quality. The main software pipeline used for multi-crystal experiments is xia2.multiplex.
If you have made use of xia2.multiplex in your data processing, please cite Gildea, R. J. et al. (2022) Acta Cryst. D78, 752-769. If you have made use of the clustering features, please additionally cite Thompson, A. J. et al. (2025) Acta Cryst. D81, 278-290.
Symmetry Considerations
In a multi-crystal experiment, it is critical for all datasets to be assigned the same symmetry prior to merging. This can be challenging when only small wedges of each crystal are measured. Where multiple valid indexing modes exist, it is also critical that the choice of indexing mode is consistent for each dataset, as failure to do so would result in artifically twinned data. xia2.multiplex uses dials.cosym which automatically resolves these symmetry requirements. To understand how the cosym algorithm resolves symmetry in multi-crystal data, refer to the cosym publication.
Preferential Orientation
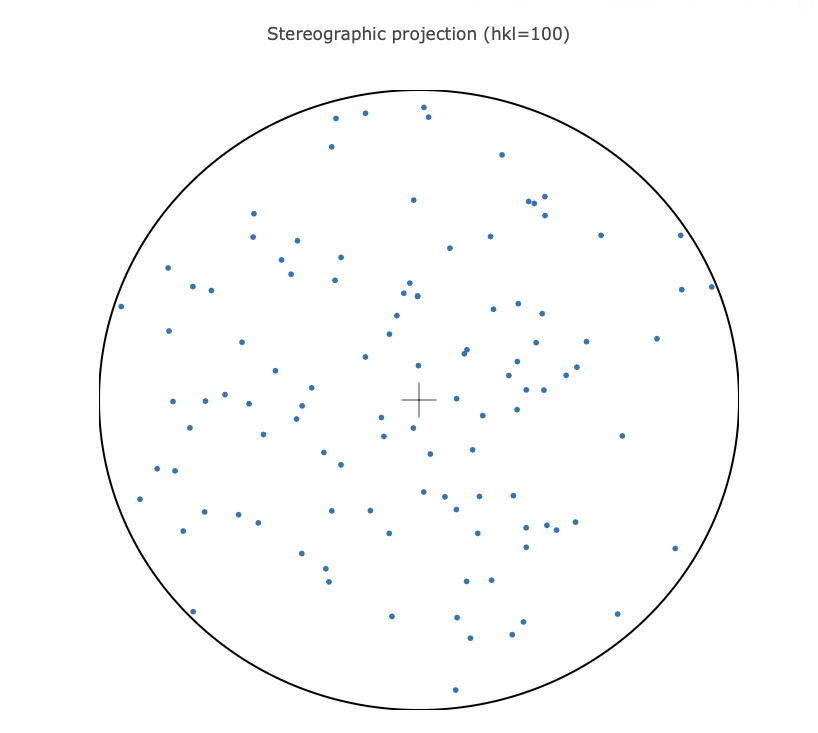
Due to the small wedge size and/or sample environment constraints common in multi-crystal experiments, it is not uncommon to have issues with preferential orientation. This occurs when all of the crystals are measured in similar orientations, meaning the same small volumes of reciprocal space are measured repeatedly and the resulting data is incomplete. Coverage of reciprocal space can be assessed by stereographic projection plots. These are available in the xia2.multiplex.html log output (see below for log location in ISPyB). If the dots are widely distributed around the circles, then there is wide coverage of reciprocal space and preferential orientation is not an issue. If this is an issue, it may be advisable to attempt alternative crystallisation strategies.
Isomorphism Considerations
When performing a multi-crystal experiment, a significant challenge is selecting which datasets are merged, as there are a number of differences which could occur between crystals:
- differences in conformation
- differences in binding events
- different states of dehydration
- differences in crystal quality
- difference in radiation damage
- entirely different samples!
Xia2.multiplex offers two methods to separate differences in datasets in multi-crystal experiments: unit cell clustering and intensity-based clustering.
Unit Cell Clustering
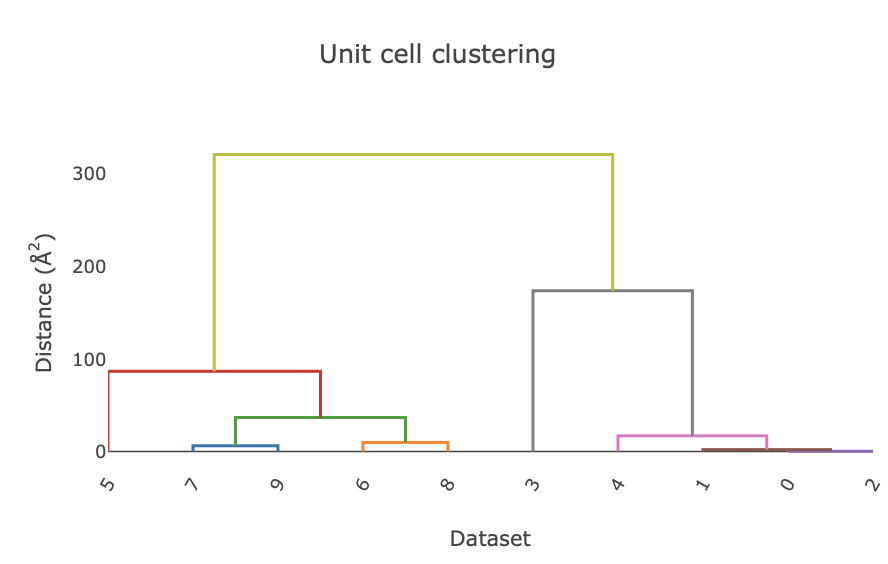
The unit cell clustering algorithm within xia2.multiplex filters out any datasets which are significantly different from the majority. It uses a technique called hierarchical clustering, where the datasets are clustered into a dendrogram based on unit cell similarity. Datasets which join further up the dendrogram have more dissimilar unit cells. In this example, there are clearly two different unit cell populations, as the two sub groups join with a high distance on the y-axis of the dendrogram.
If the automatic criteria for rejection is not harsh enough, altering the unit cell clustering threshold with Manual Reprocessing can be done (see Useful Tutorials for additional guidance).
Intensity-based Clustering
Included in the xia2.multiplex algorithm is an intensity-based clustering analysis. This can identifying if splitting the data into subsets significantly increases the isomorphism of the resulting merged dataset(s). For example, it can separate apo vs ligand-bound data. The clustering analysis can be found in the `xia2.multiplex.html` log file. In ISPyB, open a completed multiplex job and click the logs and files button.

Next, find xia2.multiplex.html and either 'open' or 'view' this file. Scroll down until you find the 'Intensity clustering' tab. The results of the intensity-based clustering analysis are stored here.

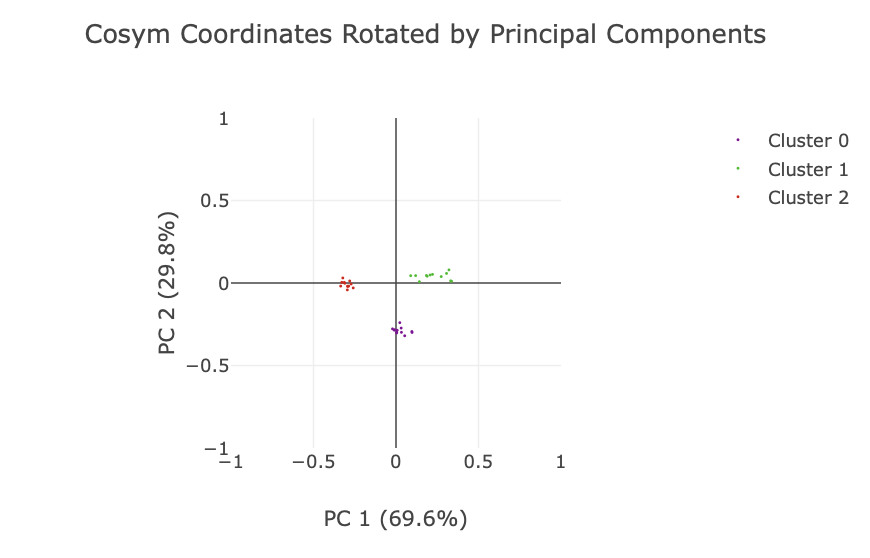
TThere are three types of clustering information displayed: correlation, cosine-angle and coordinate. The coordinate method is the preferred approach and is used for cluster output to ISPyB for multi-crystal data collections on VMXi, VMXm and I24. The datasets are automatically classified into groups which display higher internal consistency. In this example, three clusters have been identified in the coordinate approach. For more information on interpreting the various clustering graphs available, see this clustering tutorial.

Diamond Light Source is the UK's national synchrotron science facility, located at the Harwell Science and Innovation Campus in Oxfordshire.
Diamond Light Source Ltd
Diamond House
Harwell Science & Innovation Campus
Didcot
Oxfordshire
OX11 0DE
Copyright © Diamond Light Source. Diamond Light Source® and the Diamond logo are registered trademarks of Diamond Light Source Ltd
Registered in England and Wales at Diamond House, Harwell Science and Innovation Campus, Didcot, Oxfordshire, OX11 0DE, United Kingdom. Company number: 4375679. VAT number: 287 461 957. Economic Operators Registration and Identification (EORI) number: GB287461957003.