Viewing Diffraction Images
Diffraction Images within ISPyB
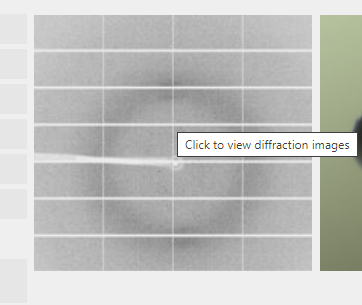
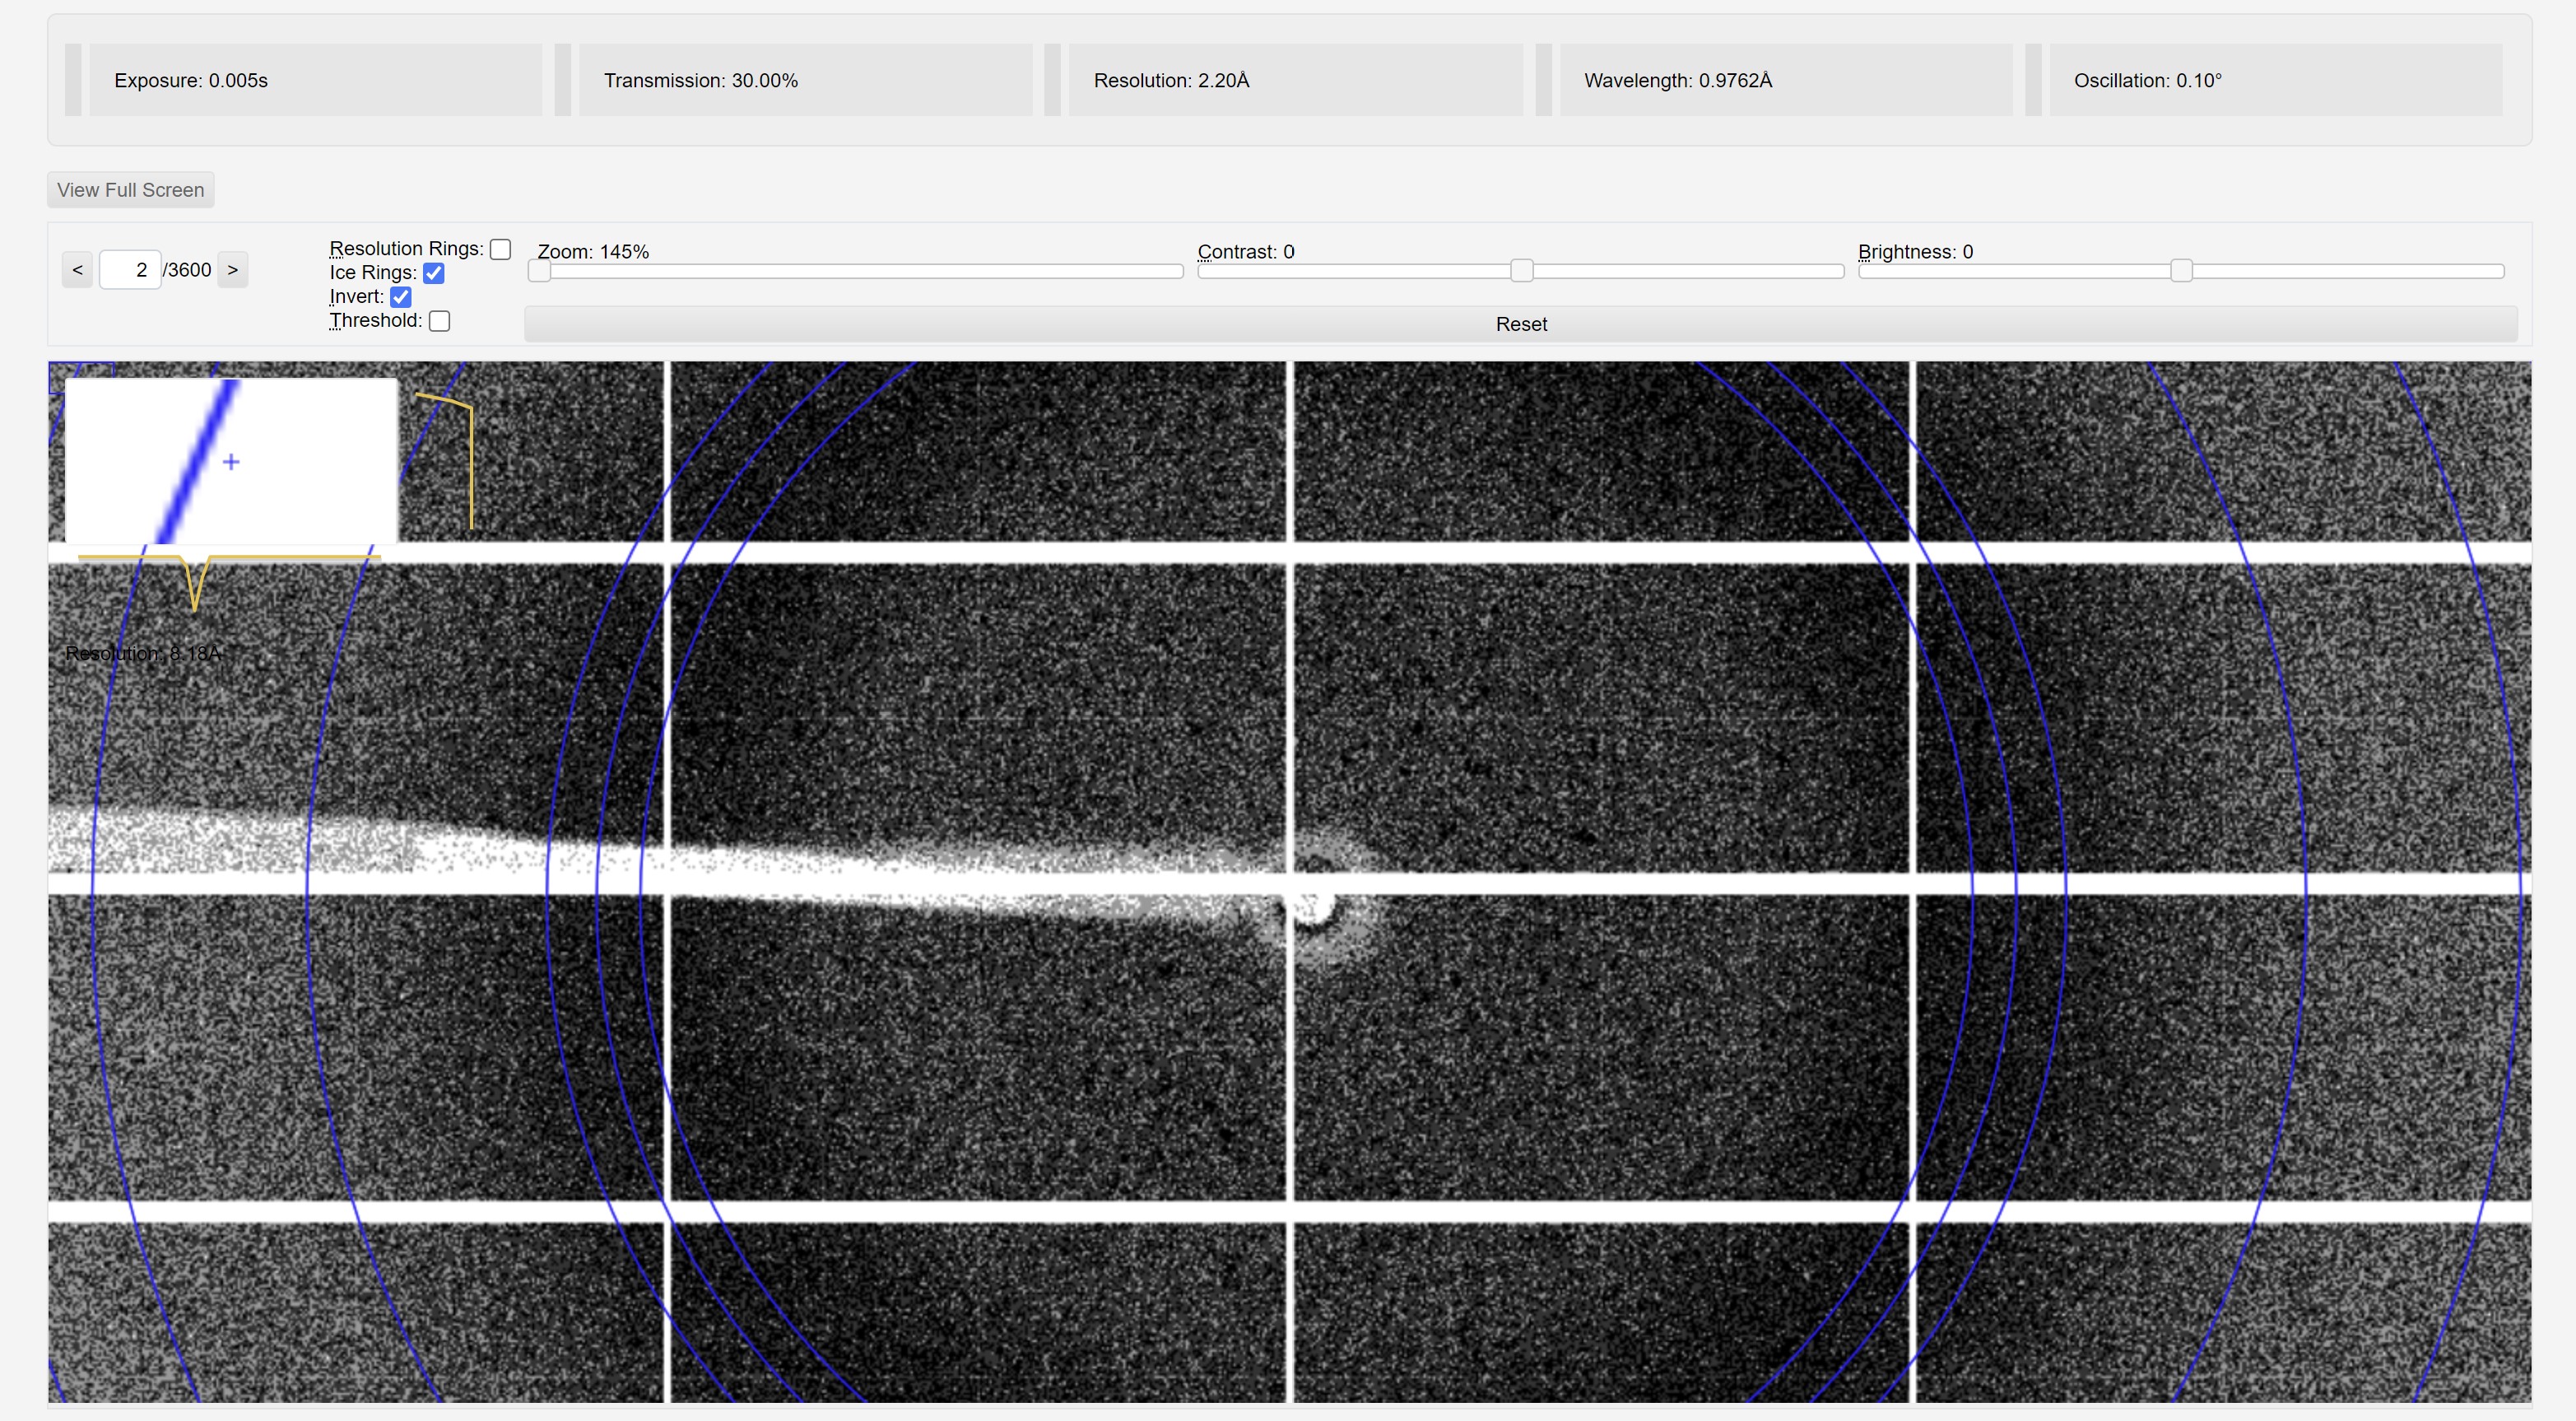
There are a low-resolution images of the diffraction patterns for each data collection, which are displayed in ISPyB. These are useful to see ice rings, such as in the image on the right, as well as other factors that may affect data quality. When the data is available on disk, the image viewer can pull higher resolution images, however as the viewer uses lossy JPEGs, it should not be used to judge the resolution. Alternate viewers are discussed below.
First click the low resolution preview to open the viewer:
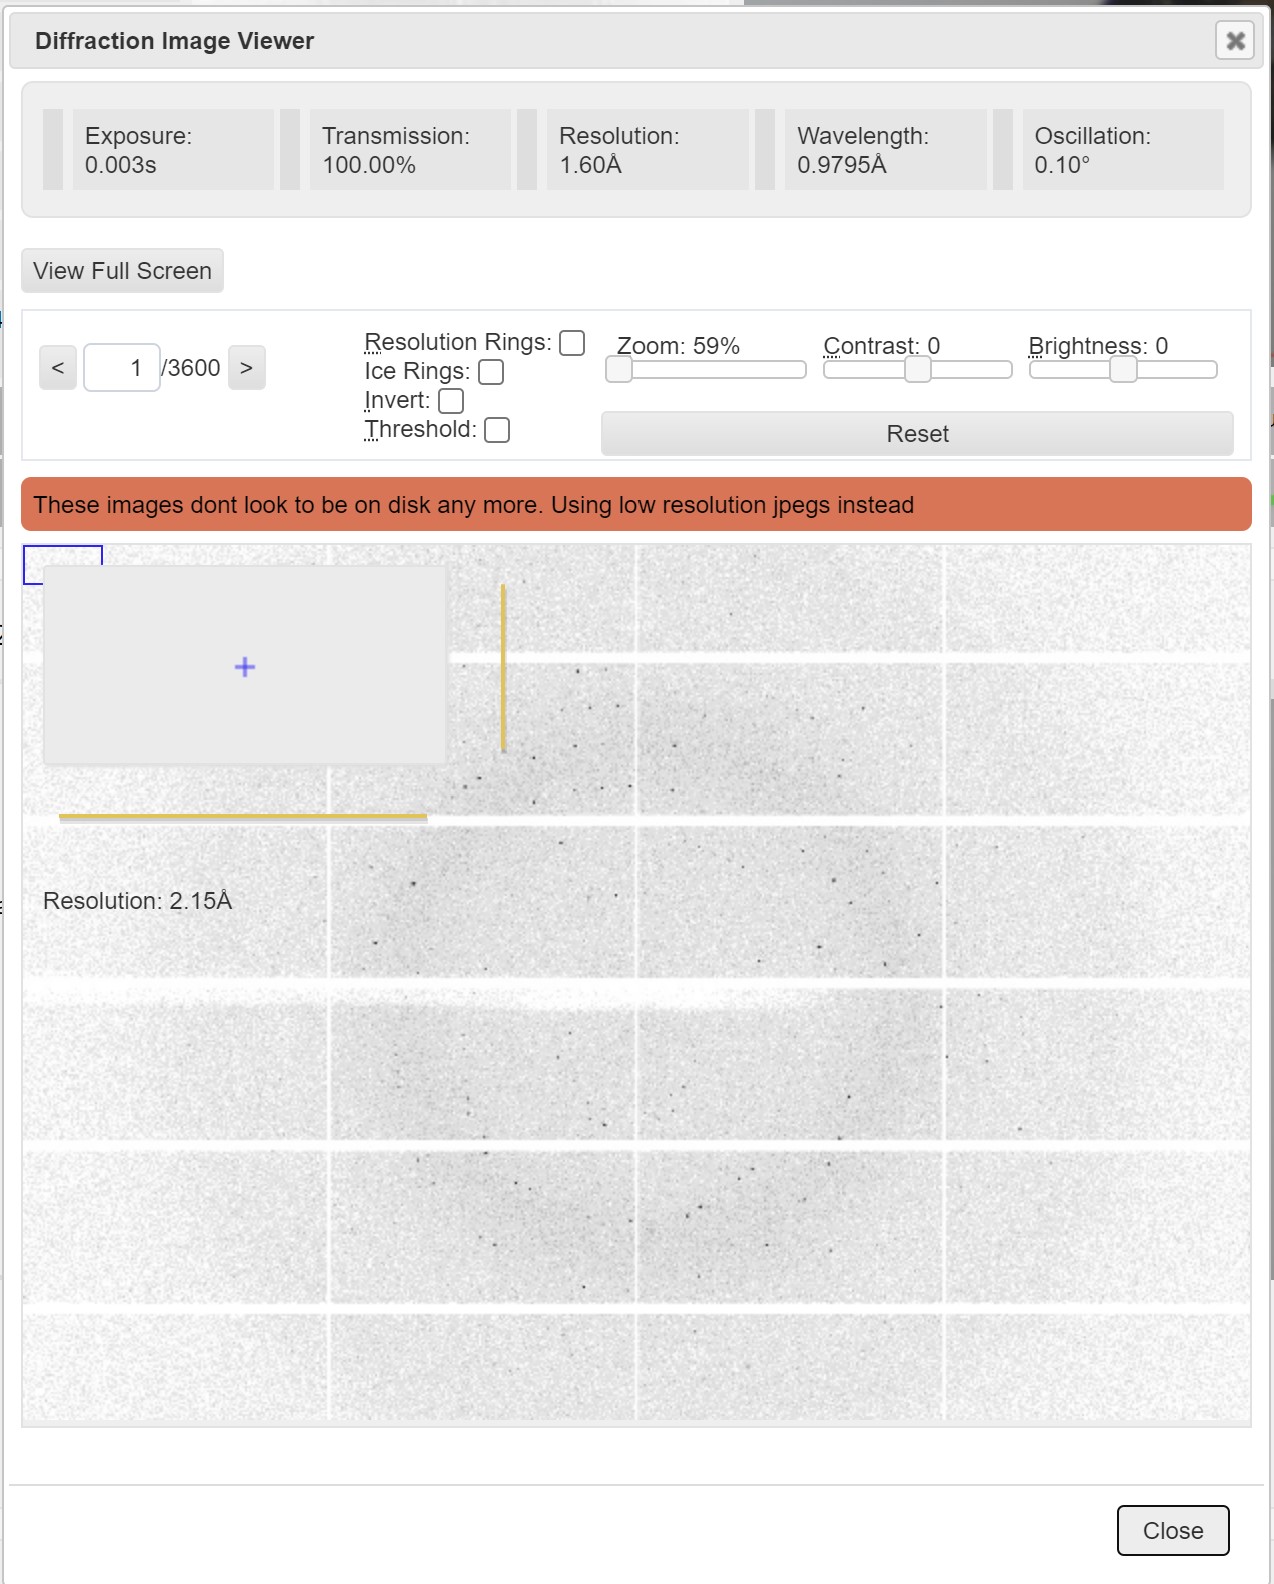
This brings up the diffraction image viewer:
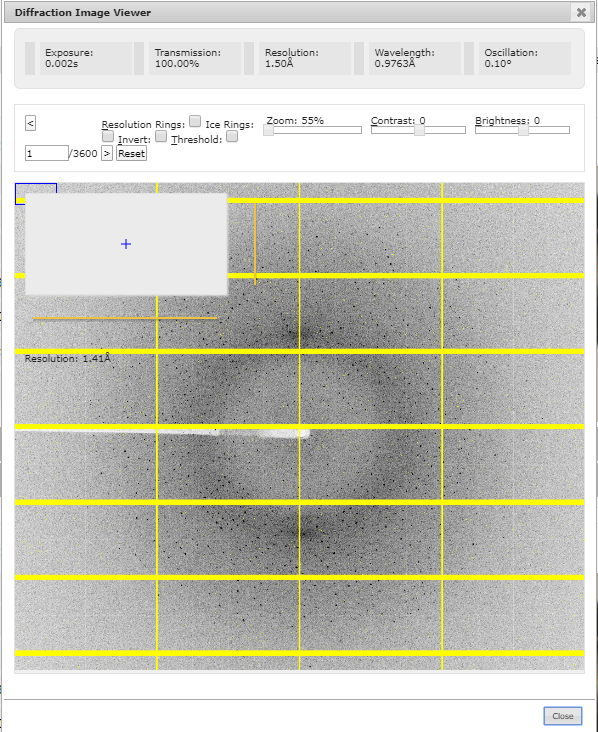
Within the viewer it is possible to threshold original images, which can be useful for viewing spots:
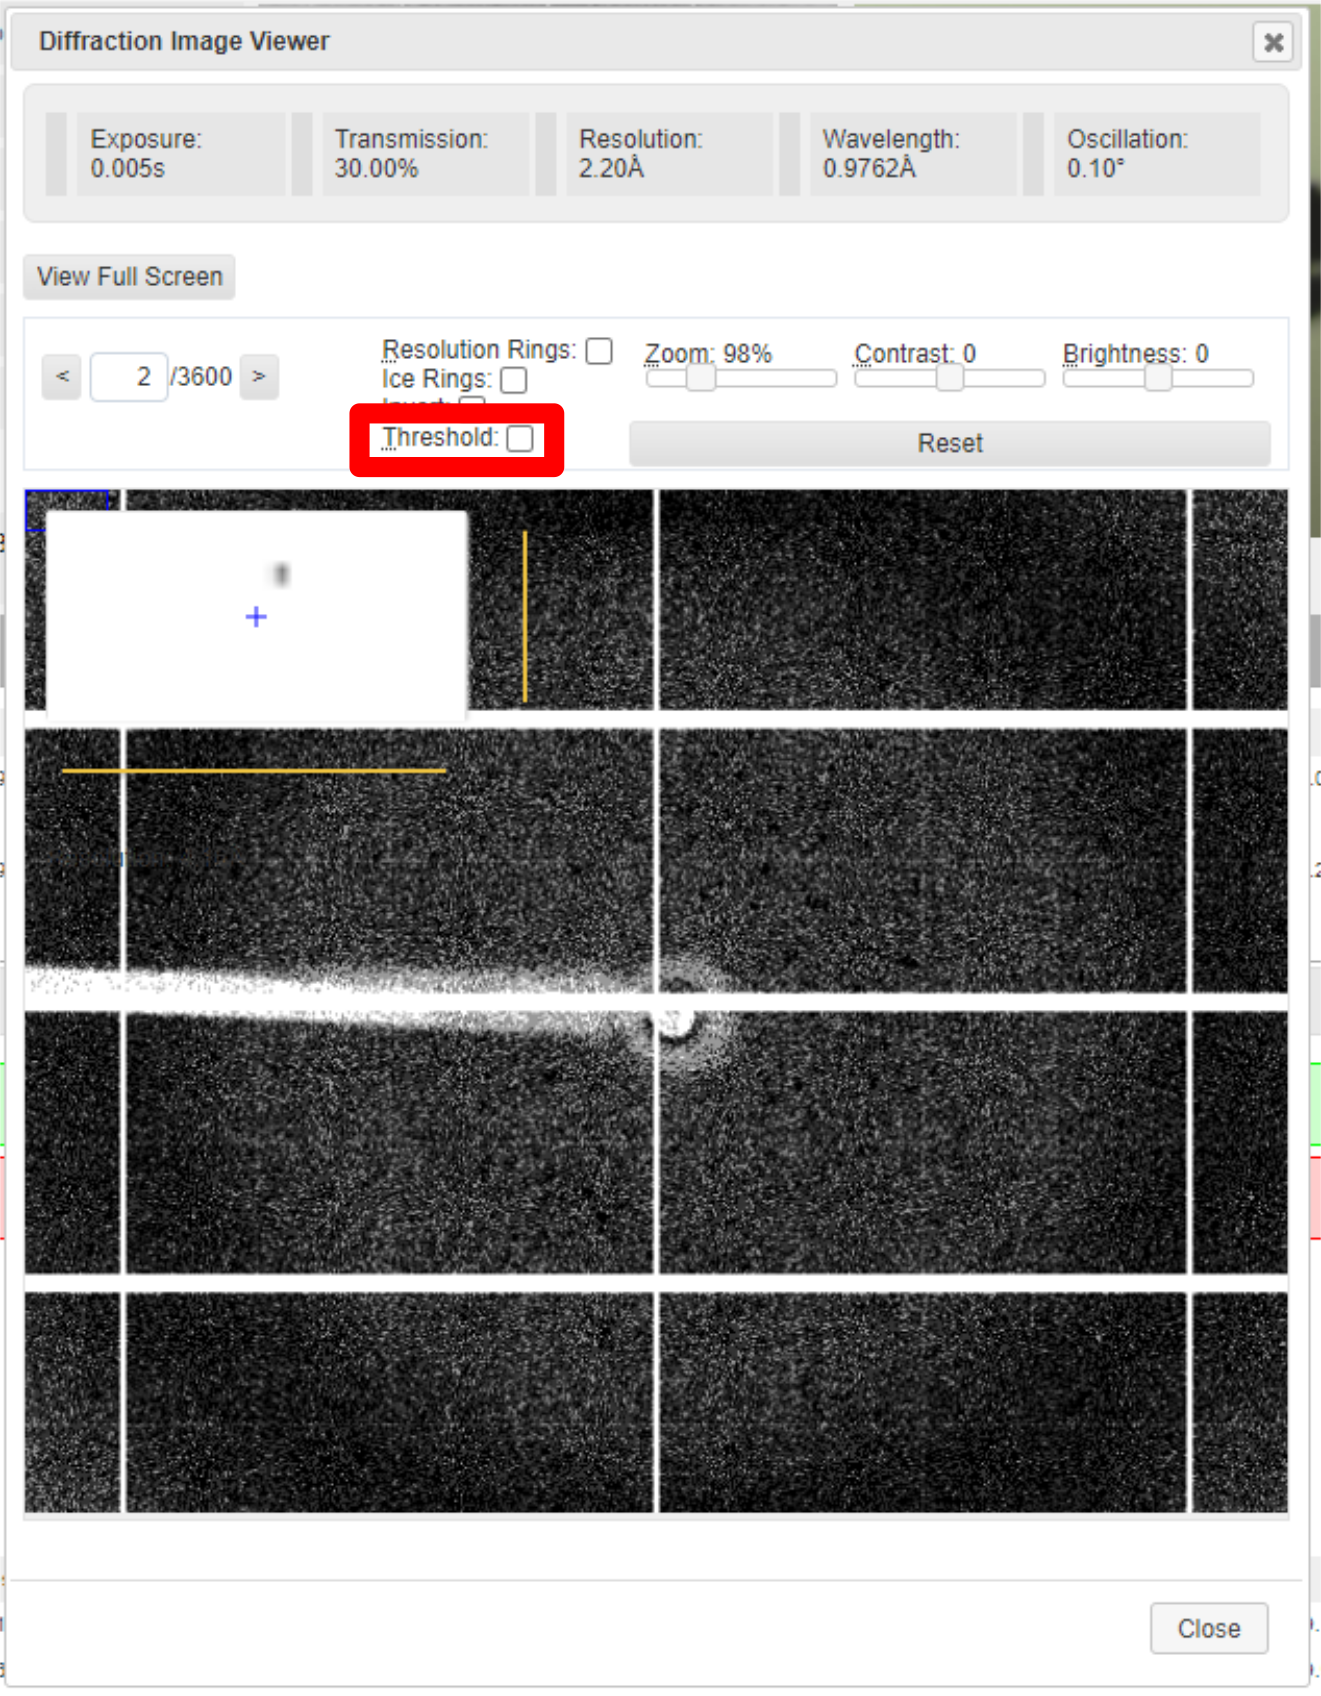
Which gives:
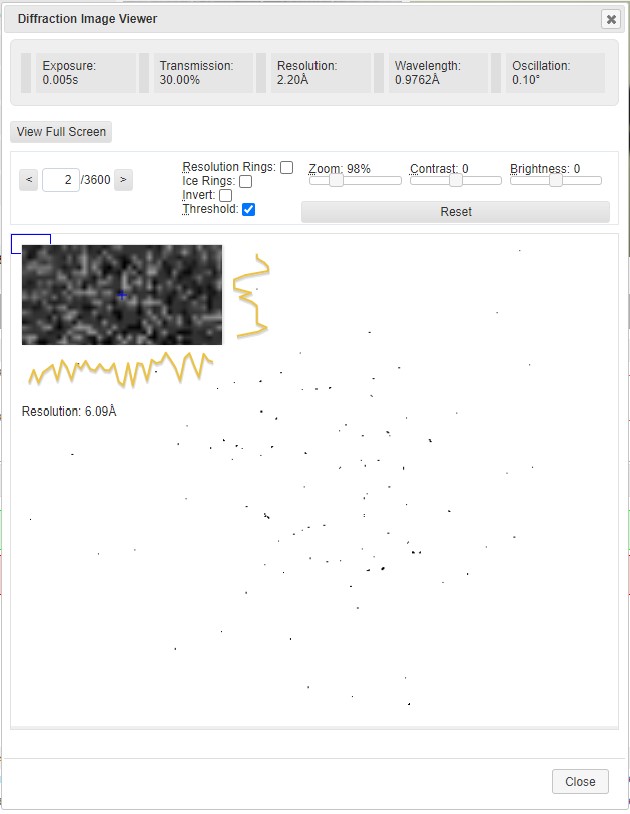
If the original data cannot be accessed off disk only low resolution previews will be available.
It is also possible to switch to a full screen view and add markers for ice rings:
When data is finely sliced it is usually beneficial to view slabs of multiple images, which would require an alternative viewer.
Alternative Image Viewers
To view the diffraction images in full, an alternative viewer is needed such as:
- DIALS image viewer which also has a useful tutorial
- To run whilst logged onto a cluster node:
- module load dials
- dials.image_viewer *master.h5
- ADXV which is found on all beamline workstations, and is also freeware, which will operate on most Linux platforms - full manual
- To run whilst logged onto a cluster node:
- module load adxv
- adxv *.h5
- ALBULA is DECTRIS' dedicated software for display and analysis of image data from PILATUS and EIGER detectors
- To run whilst logged onto a cluster node:
- module load albula
- albula
- Then select the appropriate master/ image file
To access viewers via NX access to a cluster node see our remote access guidlines.
Fine slicing
Fast detectors mean that fine-slicing data is possible - looking at wedges of data from fractions of a degree of rotation, which can increase the resolution. However, this means that it is hard to see diffraction spots on individual data images. Therefore, it is worth viewing a series of images together as a slab.
Further instructions for how to do this can be found on the Eiger Detectors page.


 Macromolecular Crystallography
