Instruments by Science Group
I12 Contact
Science Group Leader
Julia Parker
Email: [email protected]
Tel: +44 (0)1235 778924
I12 JEEP: Joint Engineering, Environment and Processing
Status: Operational
Beamsize: From 50 micrometer x 50 micrometer to 50 mm x 15 mm (EH1) or 100 mm x 30 mm (EH2)
Energy: 53 – 150 keV
Energy: 53 – 150 keV
I12 hosts a variety of detectors for imaging and diffraction experiments. The table below gives the key features of these detectors.
| Detectors | Comments |
|
Large 2D area diffraction detector |
|
| Energy dispersive X-ray detector |
|
| High resolution imaging camera |
Please note that the projected pixel size in the sample plane will be slightly smaller than the camera pixel size due to beam divergence. Depending on the sample-camera distance it can decrease up to 4%. The vertical beam profile is not uniform and has maximal intensity in the middle of the image. For this reason, the upper and lower parts of the optical modules 1 and 2 are less illuminated and the corrected image shows increasing noise towards the edges. All values are for guidance only |
| High speed imaging camera |
Please note that the projected pixel size in the sample plane will be slightly smaller than the camera pixel size due to beam divergence. Depending on the sample-camera distance it can decrease up to 4%. The vertical beam profile is not uniform and has maximal intensity in the middle of the image. For this reason, the upper and lower parts of the optical modules 1 and 2 are less illuminated and the corrected image shows increasing noise towards the edges. All values are for guidance only |
| Large Field of View camera |
The vertical beam profile is not uniform and has maximal intensity in the middle of the image. For this reason, the upper and lower parts of the optical modules 1 and 2 are less illuminated and the corrected image shows increasing noise towards the edges. |
Large 2D area diffraction detector
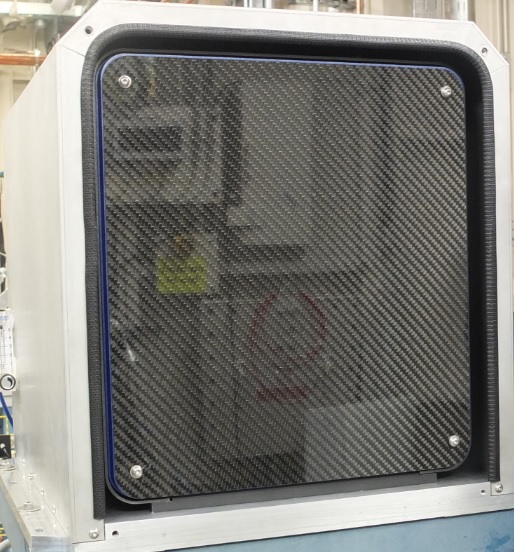
- Detector: Pilatus3 X CdTe 2M
- Technology: CdTe single crystal
- Pixel size 172 µm × 172 µm
- Active area: 1475 × 1679 pixel
- Active area size: 253.7 mm × 288.8 mm
- Available for experiments in EH1 and EH2
The Pilatus detector can be operated in internal software triggering mode with frame rate up to 2 frames/sec with sample metadata (sample temperature, voltage, etc.), and in internal software triggering mode with frame rate up to 250 frames/sec without sample metadata.
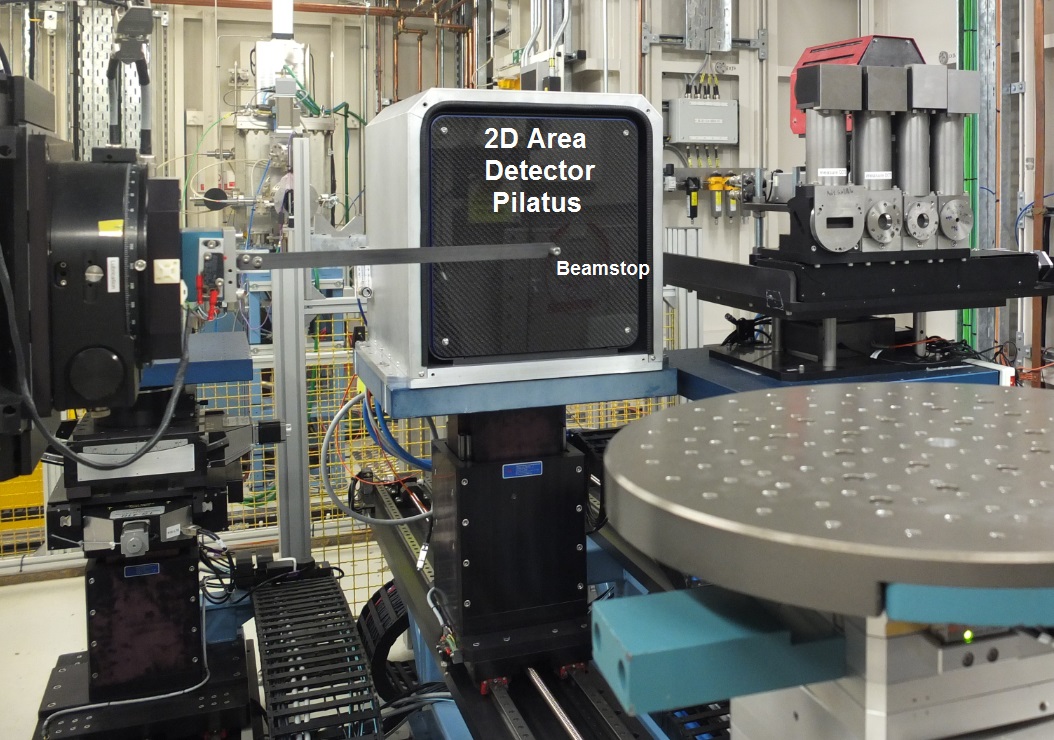
Pilatus 2D Area detector on Module 2 and beamstop on Module 4 of Large Detector Table 1 (LDT1) in Experimental Hutch 1 (EH1). Behind 2D area detector on the left side is an imaging camera with four optical modules on Module 1 of LDT1.
Flat panel 2D area detector Pilatus can be installed on Large Detector Table (LDT) or on Small detector Table (SDT) in Experimental Hutch 1 (EH1) or Experimental Hutch 2 (EH2). All detector tables support a large range of coarse translations and Large Detector Table supports a large range of sample-detector distances, thus measurements in the large q-range (q=2*pi/d=4*pi*sin(theta)/Lambda) are possible.
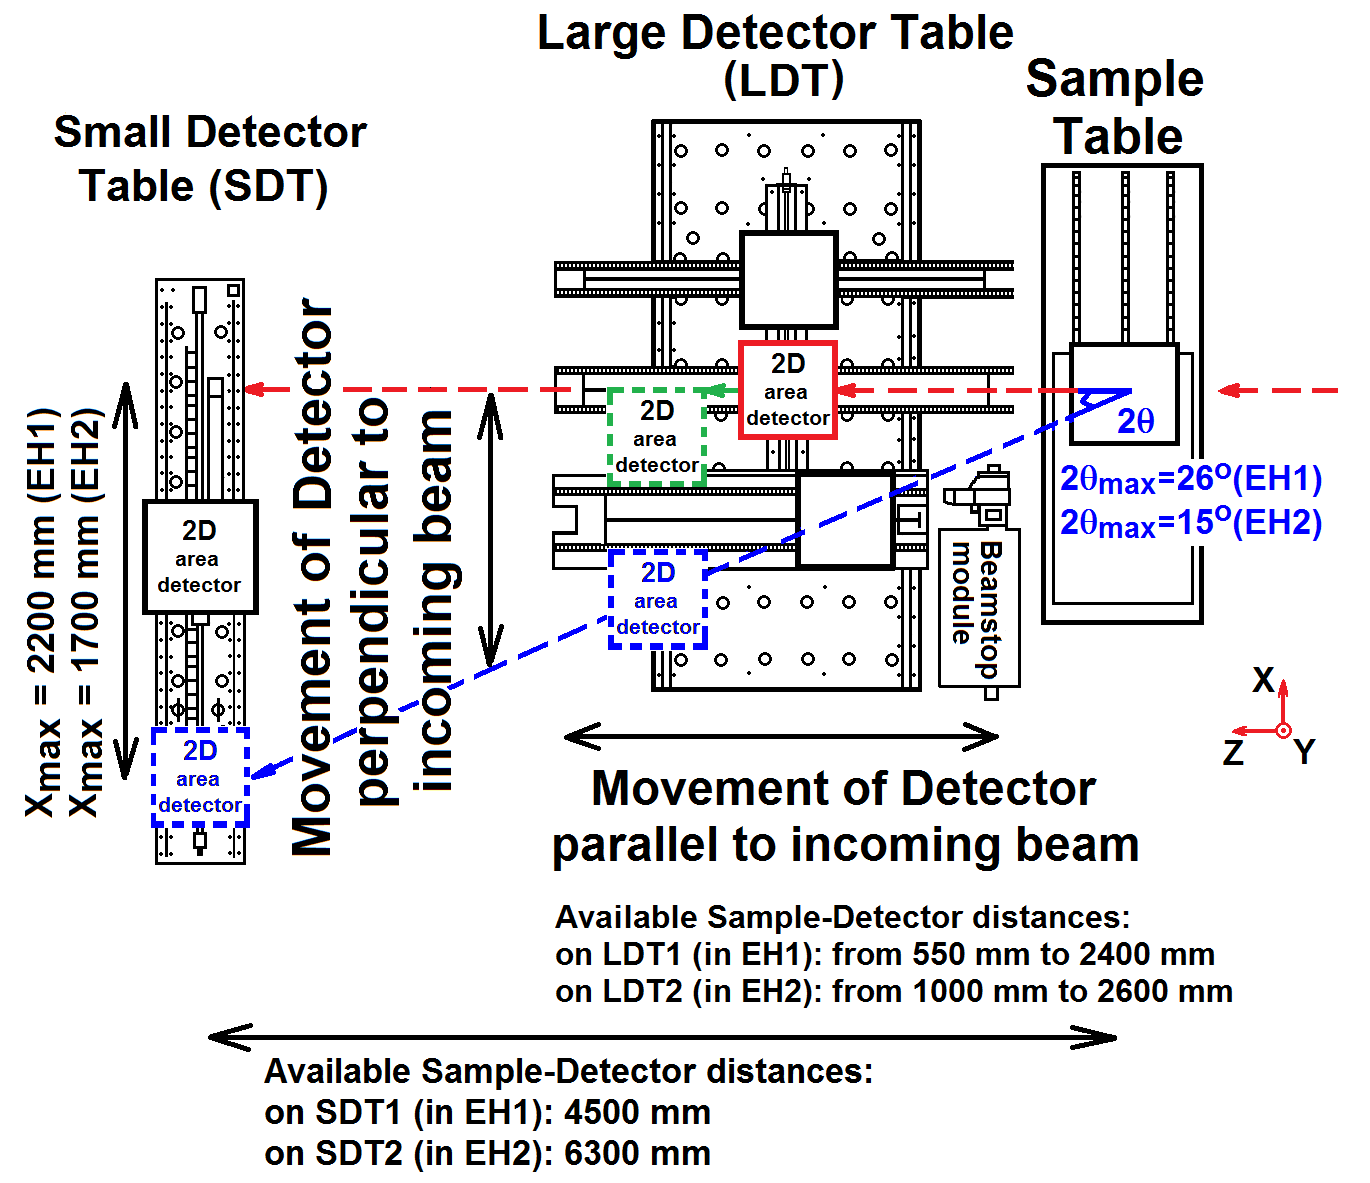
Available positions of the Flat panel 2D area detector in both Experimental hutches, EH1 (with beamstop module) and EH2 (without beamstop module) on the Large Detector Table (LDT) or the Small Detector Table (SDT). Each Detector Table can be moved remotely through the Experimental Hutch to vary the measured q-range and the sample-to-detector distance during the experiment. The off-centred position of the 2D area detector on the LDT is represented by green dashed lines, and its maximal transverse offset position on each Detector Table is represented by blue dashed lines.
Depending on the sample-detector distance and the monochromator energy, a range of q‑values can be accessed. All q‑values reported are calculated values and for guidance only.
Table for qmin, qmax, dmin, dmax, Δq/q (determined as Δθ / tan(θ), where Δθ is"pixel size" / "sample-detector distance") for 2D area detector Pilatus in Experimental Hutch 1 (all values are for guidance only):
| Detector centred (beamstop is in the centre of the detector, red line on fig. above) | Detector off-centred (beamstop is on the site of the detector, green line on fig. above) | Detector shifted to maximal scattering angle (beamstop is outside of the detector, blue line on fig. above) | |||||||||||||
|
Distance [mm] |
qmin [Å-1] |
qmax [Å-1] |
dmin [Å] |
dmax [Å] |
Δq/q |
qmin [Å-1] |
qmax [Å-1] |
dmin [Å] |
dmax [Å] |
Δq/q |
qmin [Å-1] |
qmax [Å-1] |
dmin [Å] |
dmax [Å] |
Δq/q |
| For energy 55 keV | |||||||||||||||
| 550 | 0.25 | 6.2 | 1.0 | 24.7 | 2.72e-03 | 0.25 | 11.8 | 0.53 | 24.7 | 1.29e-03 | 7.1 | 17.0 | 0.37 | 0.89 | 6.92e-04 |
| 1 000 | 0.14 | 3.4 | 1.8 | 45.0 | 2.74e-03 | 0.14 | 6.8 | 0.92 | 45.0 | 9.65e-04 | 9.6 | 15.1 | 0.41 | 0.65 | 4.84e-04 |
| 2 400 | 0.06 | 1.4 | 4.3 | 108 | 2.75e-03 | 0.06 | 2.9 | 2.2 | 108 | 5.27e-04 | 11.4 | 13.6 | 0.46 | 0.55 | 2.43e-04 |
| 4 500 | 0.03 | 0.8 | 8.1 | 202 | 2.75e-03 | 0.03 | 1.5 | 4.0 | 202 | 3.12e-04 | 11.9 | 12.5 | 0.50 | 0.52 | 1.38e-04 |
| For energy 100 keV | |||||||||||||||
| 550 | 0.46 | 11.3 | 0.55 | 13.6 | 2.72e-03 | 0.46 | 21.4 | 0.29 | 13.6 | 1.29e-03 | 12.9 | 30.9 | 0.20 | 0.49 | 6.92e-04 |
| 1 000 | 0.25 | 6.3 | 1.0 | 24.7 | 2.74e-03 | 0.25 | 12.4 | 0.51 | 24.7 | 9.65e-04 | 17.5 | 27.5 | 0.23 | 0.35 | 4.84e-04 |
| 2 400 | 0.11 | 2.6 | 2.4 | 59.5 | 2.75e-03 | 0.11 | 5.2 | 1.1 | 59.5 | 5.27e-04 | 20.7 | 24.8 | 0.25 | 0.30 | 2.43e-04 |
| 4 500 | 0.06 | 1.4 | 4.4 | 111 | 2.75e-03 | 0.06 | 2.8 | 2.2 | 111 | 3.12e-04 | 21.7 | 22.8 | 0.28 | 0.29 | 1.38e-04 |
| For energy 150 keV | |||||||||||||||
| 550 | 0.69 | 16.9 | 0.37 | 9.1 | 2.72e-03 | 0.69 | 32.2 | 0.20 | 9.1 | 1.29e-03 | 19.3 | 46.4 | 0.13 | 0.33 | 6.92e-04 |
| 1 000 | 0.38 | 9.4 | 0.66 | 16.5 | 2.74e-03 | 0.38 | 18.6 | 0.34 | 16.5 | 9.65e-04 | 26.3 | 41.3 | 0.15 | 0.24 | 4.84e-04 |
| 2 400 | 0.16 | 3.9 | 1.6 | 39.6 | 2.75e-03 | 0.16 | 7.9 | 0.80 | 39.6 | 5.27e-04 | 31.0 | 37.2 | 0.17 | 0.20 | 2.43e-04 |
| 4 500 | 0.08 | 2.1 | 3.0 | 74.3 | 2.75e-03 | 0.08 | 4.2 | 1.5 | 74.3 | 3.12e-04 | 32.6 | 34.2 | 0.18 | 0.19 | 1.38e-04 |
Table for qmin, qmax, dmin, dmax, Δq/q (determined as Δθ / tan(θ), where Δθ is"pixel size" / "sample-detector distance") for 2D area detector Pilatus in Experimental Hutch 2 (all values are for guidance only):
| Detector centred (beamstop is in the centre of the detector, red line on fig. above) | Detector off-centred (beamstop is on the site of the detector, green line on fig. above) | Detector shifted to maximal scattering angle (beamstop is outside of the detector, blue line on fig. above) | |||||||||||||
| Distance [mm] | qmin
[Å-1] |
qmax
[Å-1] |
dmin
[Å] |
dmax
[Å] |
Δq/q | qmin
[Å-1] |
qmax
[Å-1] |
dmin [Å] |
dmax [Å] |
Δq/q | qmin
[Å-1] |
qmax
[Å-1] |
dmin [Å] |
dmax [Å] |
Δq/q |
| For energy 55 keV | |||||||||||||||
| 1000 | 0.14 | 3.5 | 1.8 | 45.0 | 2.74e-03 | 0.14 | 6.8 | 0.92 | 45.0 | 2.74e-03 | 25.3 | 27.2 | 0.23 | 0.25 | 1.24e-04 |
| 2000 | 0.07 | 1.7 | 3.6 | 90.1 | 2.75e-03 | 0.07 | 3.46 | 1.8 | 90.1 | 2.75e-03 | 16.5 | 18.6 | 0.34 | 0.38 | 1.78e-04 |
| 2600 | 0.05 | 1.3 | 4.7 | 117 | 2.75e-03 | 0.05 | 2.67 | 2.3 | 117 | 2.75e-03 | 13.4 | 15.4 | 0.41 | 0.47 | 1.89e-04 |
| 6300 | 0.02 | 0.5 | 11.4 | 284 | 2.75e-03 | 0.02 | 1.11 | 5.7 | 284 | 2.75e-03 | 6.8 | 7.8 | 0.8 | 0.9 | 2.07e-04 |
| For energy 100 keV | |||||||||||||||
| 1000 | 0.25 | 6.3 | 1.0 | 24.7 | 2.74e-03 | 0.25 | 12.4 | 0.51 | 24.7 | 2.74e-03 | 46.0 | 49.4 | 0.13 | 0.14 | 1.24e-04 |
| 2000 | 0.12 | 3.2 | 2.0 | 49.5 | 2.75e-03 | 0.13 | 6.3 | 1.0 | 49.5 | 2.75e-03 | 30.1 | 33.9 | 0.18 | 0.21 | 1.78e-04 |
| 2600 | 0.10 | 2.4 | 2.6 | 64.4 | 2.75e-03 | 0.10 | 4.8 | 1.3 | 64.4 | 2.75e-03 | 24.4 | 27.9 | 0.22 | 0.26 | 1.89e-04 |
| 6300 | 0.04 | 1.0 | 6.2 | 156 | 2.75e-03 | 0.04 | 2.0 | 3.1 | 156 | 2.75e-03 | 12.4 | 14.2 | 0.44 | 0.50 | 2.07e-04 |
| For energy 150 keV | |||||||||||||||
| 1000 | 0.38 | 9.4 | 0.66 | 16.5 | 2.74e-03 | 0.38 | 18.6 | 0.34 | 16.5 | 2.74e-03 | 69.0 | 74.2 | 0.08 | 0.09 | 1.24e-04 |
| 2000 | 0.19 | 4.7 | 1.3 | 33.0 | 2.75e-03 | 0.19 | 9.4 | 0.66 | 33.0 | 2.75e-03 | 45.1 | 50.9 | 0.12 | 0.14 | 1.78e-04 |
| 2600 | 0.15 | 3.6 | 1.7 | 42.9 | 2.75e-03 | 0.14 | 7.3 | 0.86 | 42.9 | 2.75e-03 | 36.6 | 41.9 | 0.15 | 0.17 | 1.89e-04 |
| 6300 | 0.06 | 1.5 | 4.2 | 104 | 2.75e-03 | 0.06 | 3.0 |
2.1 |
104 | 2.75e-03 | 18.5 | 21.3 | 0.29 | 0.34 | 2.07e-04 |
Graphical representation of available q-ranges and d-ranges for 2D area Pilatus detector in Experimental Hutch 1 and Experimental Hutch 2 can be downloaded here.
Energy dispersive X-ray detector
- Multi-element Germanium detector, custom made by Canberra, Olen, Belgium, to a conceptual design provided by the I12 beamline.
- 23 high purity Ge detector crystals arranged in a semi-circular array with a radial take-off angle 2Θ for each element of 5°.
- Azimuthal angles cover a range from 0° to 180°, in steps of 8.18°.
- Allows powder diffraction scattering and fluorescence measurements with white beam.
- The circular arrangement of detector elements is particularly useful for strain and texture analysis with a single experimental setup.
- Can be used in combination with collimator close to the sample (first collimator). In this case the scattering volume is not only confining in two dimensions by the beam size, but also in a third dimension along the beam, allowing spatially resolved measurements, e.g. strain mapping during in situ sample deformation or investigation of samples inside strongly scattering containers, such as electrochemical and environmental cells, furnaces or pressure cells.
- Detector shows almost no intrinsic noise and can be electronically gated, allowing stroboscopic measurements where during the periodic processes the weak signal can be accumulated over many periods.
- Can be used with monochromatic beam to analyse inelastic scattering from the sample (Compton scattering, fluorescence scattering).
- As the I12 energy range spans 50 keV to 150 keV, the observed range of momentum transfer q is 2.2 Å-1 to 6.5 Å-1, d is 1.0 Å to 2.8 Å.
- Available for experiments in Experimental Hutch 2 only.
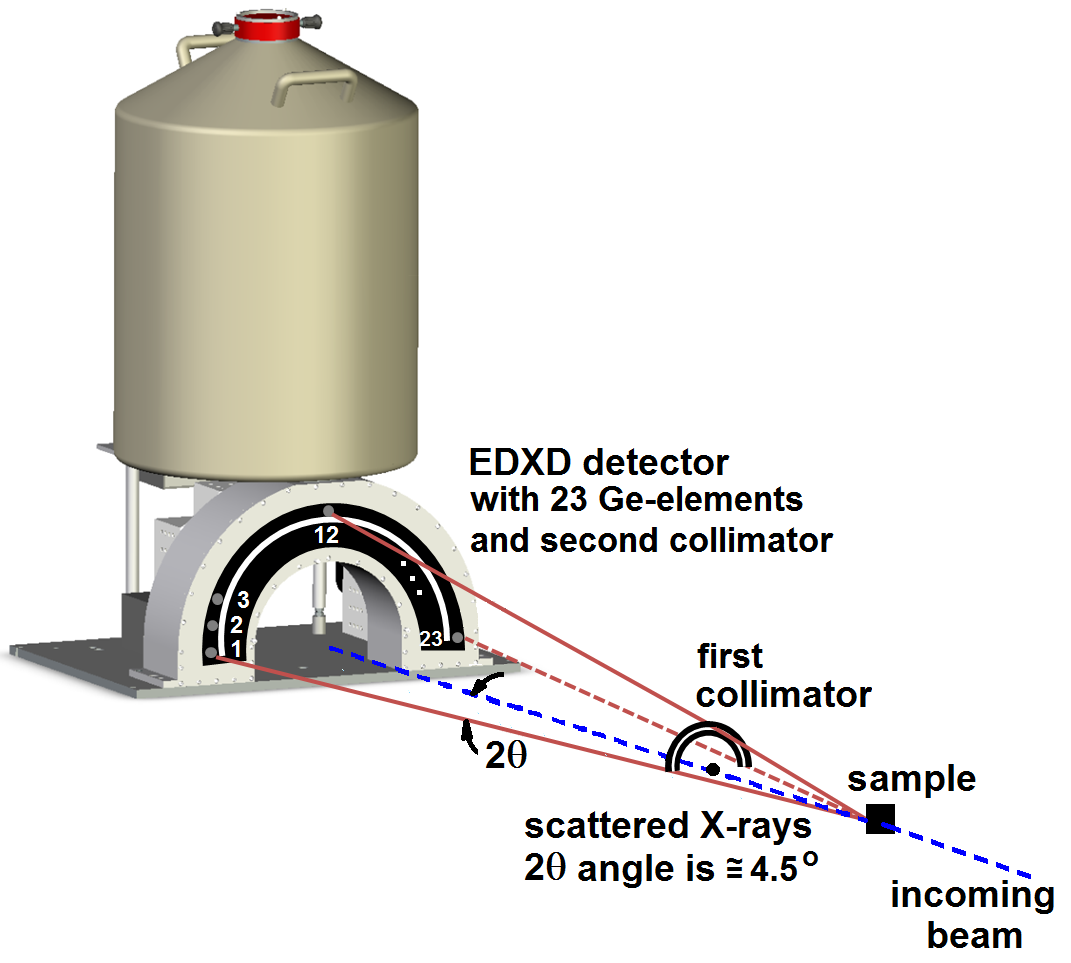
Schematic view of EDXD detector, first collimator (close to sample), and detector collimator slit geometry.
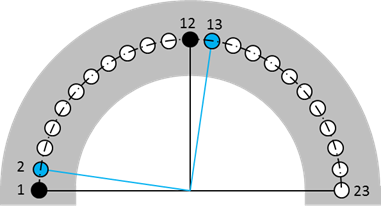
Arrangement of 23 detector crystals in a semi-angular array in EDXD detector. Two selected pairs of orthogonally oriented detector's elements are shown to aid the measurements of strain.
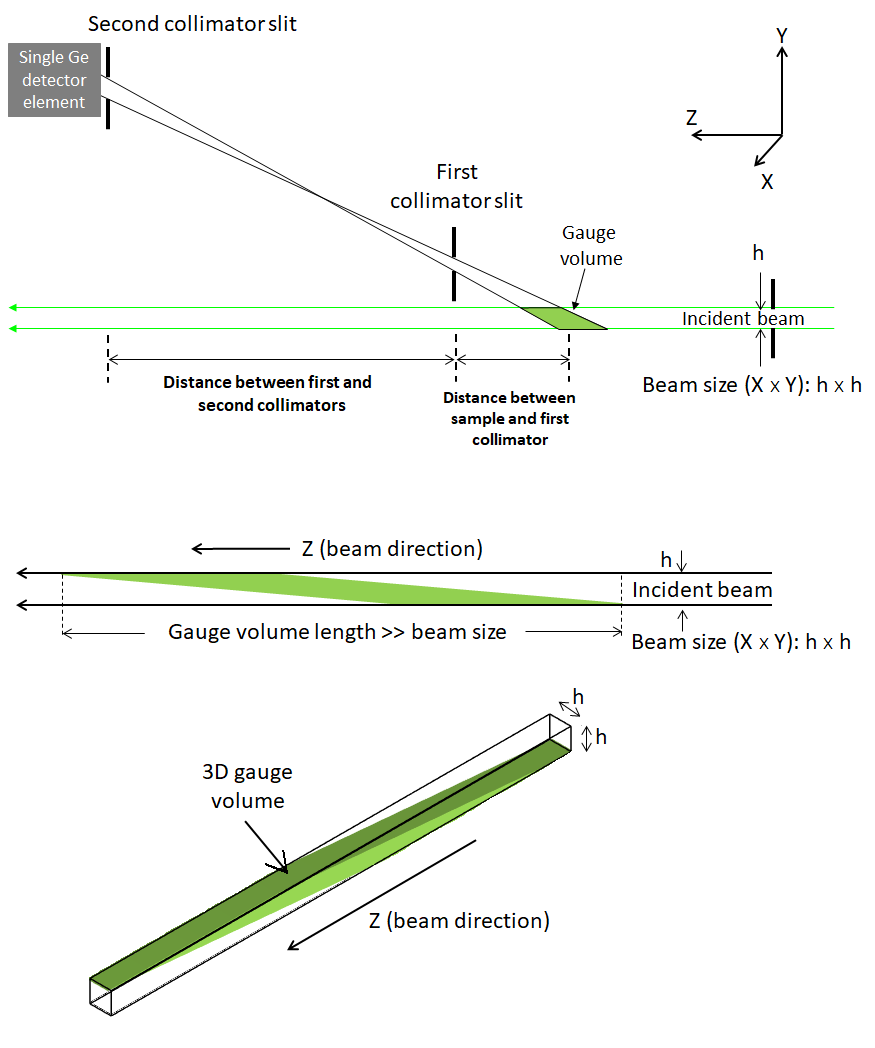
Schematic of gauge volume inside the sample
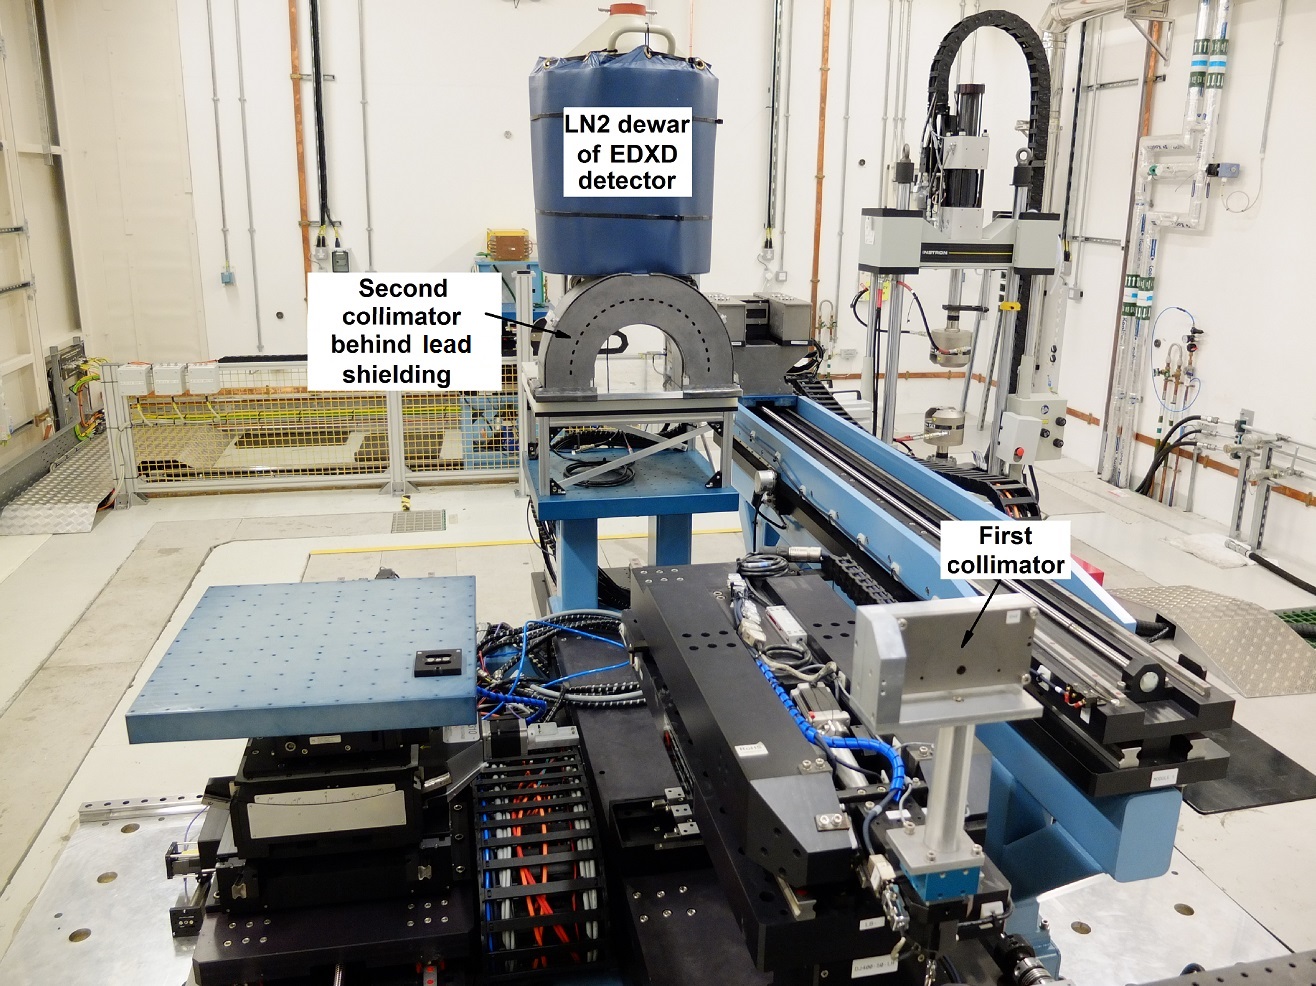
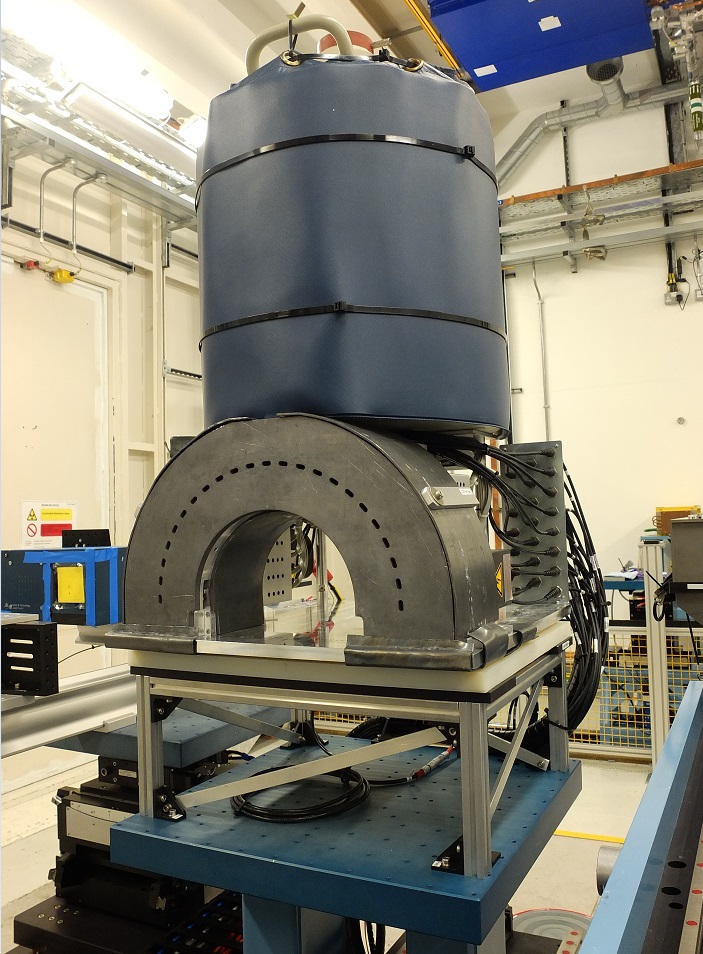
EDXD detector on Module 2 of Large Detector Table 2 (LDT2) in Experimental Hutch 2 (EH2) with first EDXD collimator on sub-module of Module 2. The second collimator (detector slits) is placed just in front of the detector front-plate and is hidden behind lead shielding. Permanent cooling is provided by liquid nitrogen from the Dewar on top of the detector.
The opening angle of the semi-circular arrangement of Ge crystals in the EDXD detector is set to 2θ ≅ 4.5°, since at the energies of beamline I12-JEEP (50 keV - 150 keV), the Bragg angles are small and so common engineering materials such as steels, aluminium, titanium etc. diffract at this angle. Only diffraction peaks from the gauge volume located within the sample are recorded, and not diffraction peaks for the sample container outside the gauge volume. This feature can be useful for probing samples located inside furnaces, autoclaves or other reaction vessels. Note that due to the low Bragg angles at high photon energies, the gauge volume is elongated in the beam direction. Please take this into account when considering the size of sample container you wish to probe inside.
The multi-element design is also an advantage for investigation of chemical processes in different sample environments. Due to the detector and collimator geometry, reflections from the material and sample environment outside of the volume predefined by collimator and beam size the (the so-called gauge volume) are excluded.
The collimating system (first and second collimators) is designed in a way that the divergence in a diffracted beam is always smaller than the corresponding energy resolution on the detector in order to preserve the optimum resolution. To permit some flexibility in gauge volume length (length along the beam which scattering will be detected by EDXD detector) and sample-to-collimator distance, two different first collimators are available: small first collimator located 100 mm behind the sample and large first collimator located 515 mm behind the sample. The elongated gauge volume must be considered when designing experiment. For further information, please contact a member of the I12 Beamline Staff.
| First collimator | Distance between sample and first collimator [mm] | 2 Θ (degrees) | ΔΘ/Θ | Δq/q at 50 keV | Δq/q at 122 keV | Δq/q at 150 keV |
| Large | 515 | 4.5 | 2.6 × 10⁻³ | 9.6 × 10⁻³ | 6.9 × 10⁻³ | 6.6 × 10⁻³ |
| Small | 100 | 4.61 | 1.8 × 10⁻³ | 8.8 × 10⁻³ | 6.1 × 10⁻³ | 5.8 × 10⁻³ |
The gauge volume length along the beam for different incident beam sizes, using large working distance (515 mm) and short working distance (100 mm) collimators (all values are for guidance only).
| Size of incident beam (mm) | 0.05 x 0.05 | 0.1 x 0.1 | 0.2 x 0.2 | 0.3 x 0.3 | 0.4 x 0.4 | 0.5 x 0.5 | 0.6 x 0.6 | 0.7 x 0.7 | 0.8 x 0.8 | 0.9 x 0.9 | 1.0 x 1.0 | |
| "Tail-to-tail" length of gauge volume along the beam (mm) | 515 mm "long working distance" collimator | 3.9 | 4.5 | 5.8 | 7.1 |
8.4 |
9.6 | 10.9 | 12.2 | 13.5 | 14.7 | 16.0 |
| 100 mm "short working distance" collimator | 2.1 | 2.7 | 3.9 | 5.2 | 6.4 | 7.6 | 8.9 | 10.1 | 11.4 | 12.6 | 13.9 |
Imaging cameras
1. Imaging camera concept
The imaging camera is a modular system which was developed in-house. It consists of scintillators, visible light custom made optical modules and commercial visible light sensors. Four optical modules are available with different resolution and field of view. These four optical modules are mounted next to each other on a translation stage and can be changed remotely. They can be used either with a high resolution imaging detector PCO.edge or with a high speed detector MIRO 310M. The material and thickness of the scintillators in each optical module are chosen to provide the best available match to the associated lenses.
Each optical module includes:
- scintillator to convert the incident X-ray beam into visible light
- mirrors to reflect the visible light out of the X-ray beam path
- visible light optics to magnify the scintillator image onto the camera's sensor.
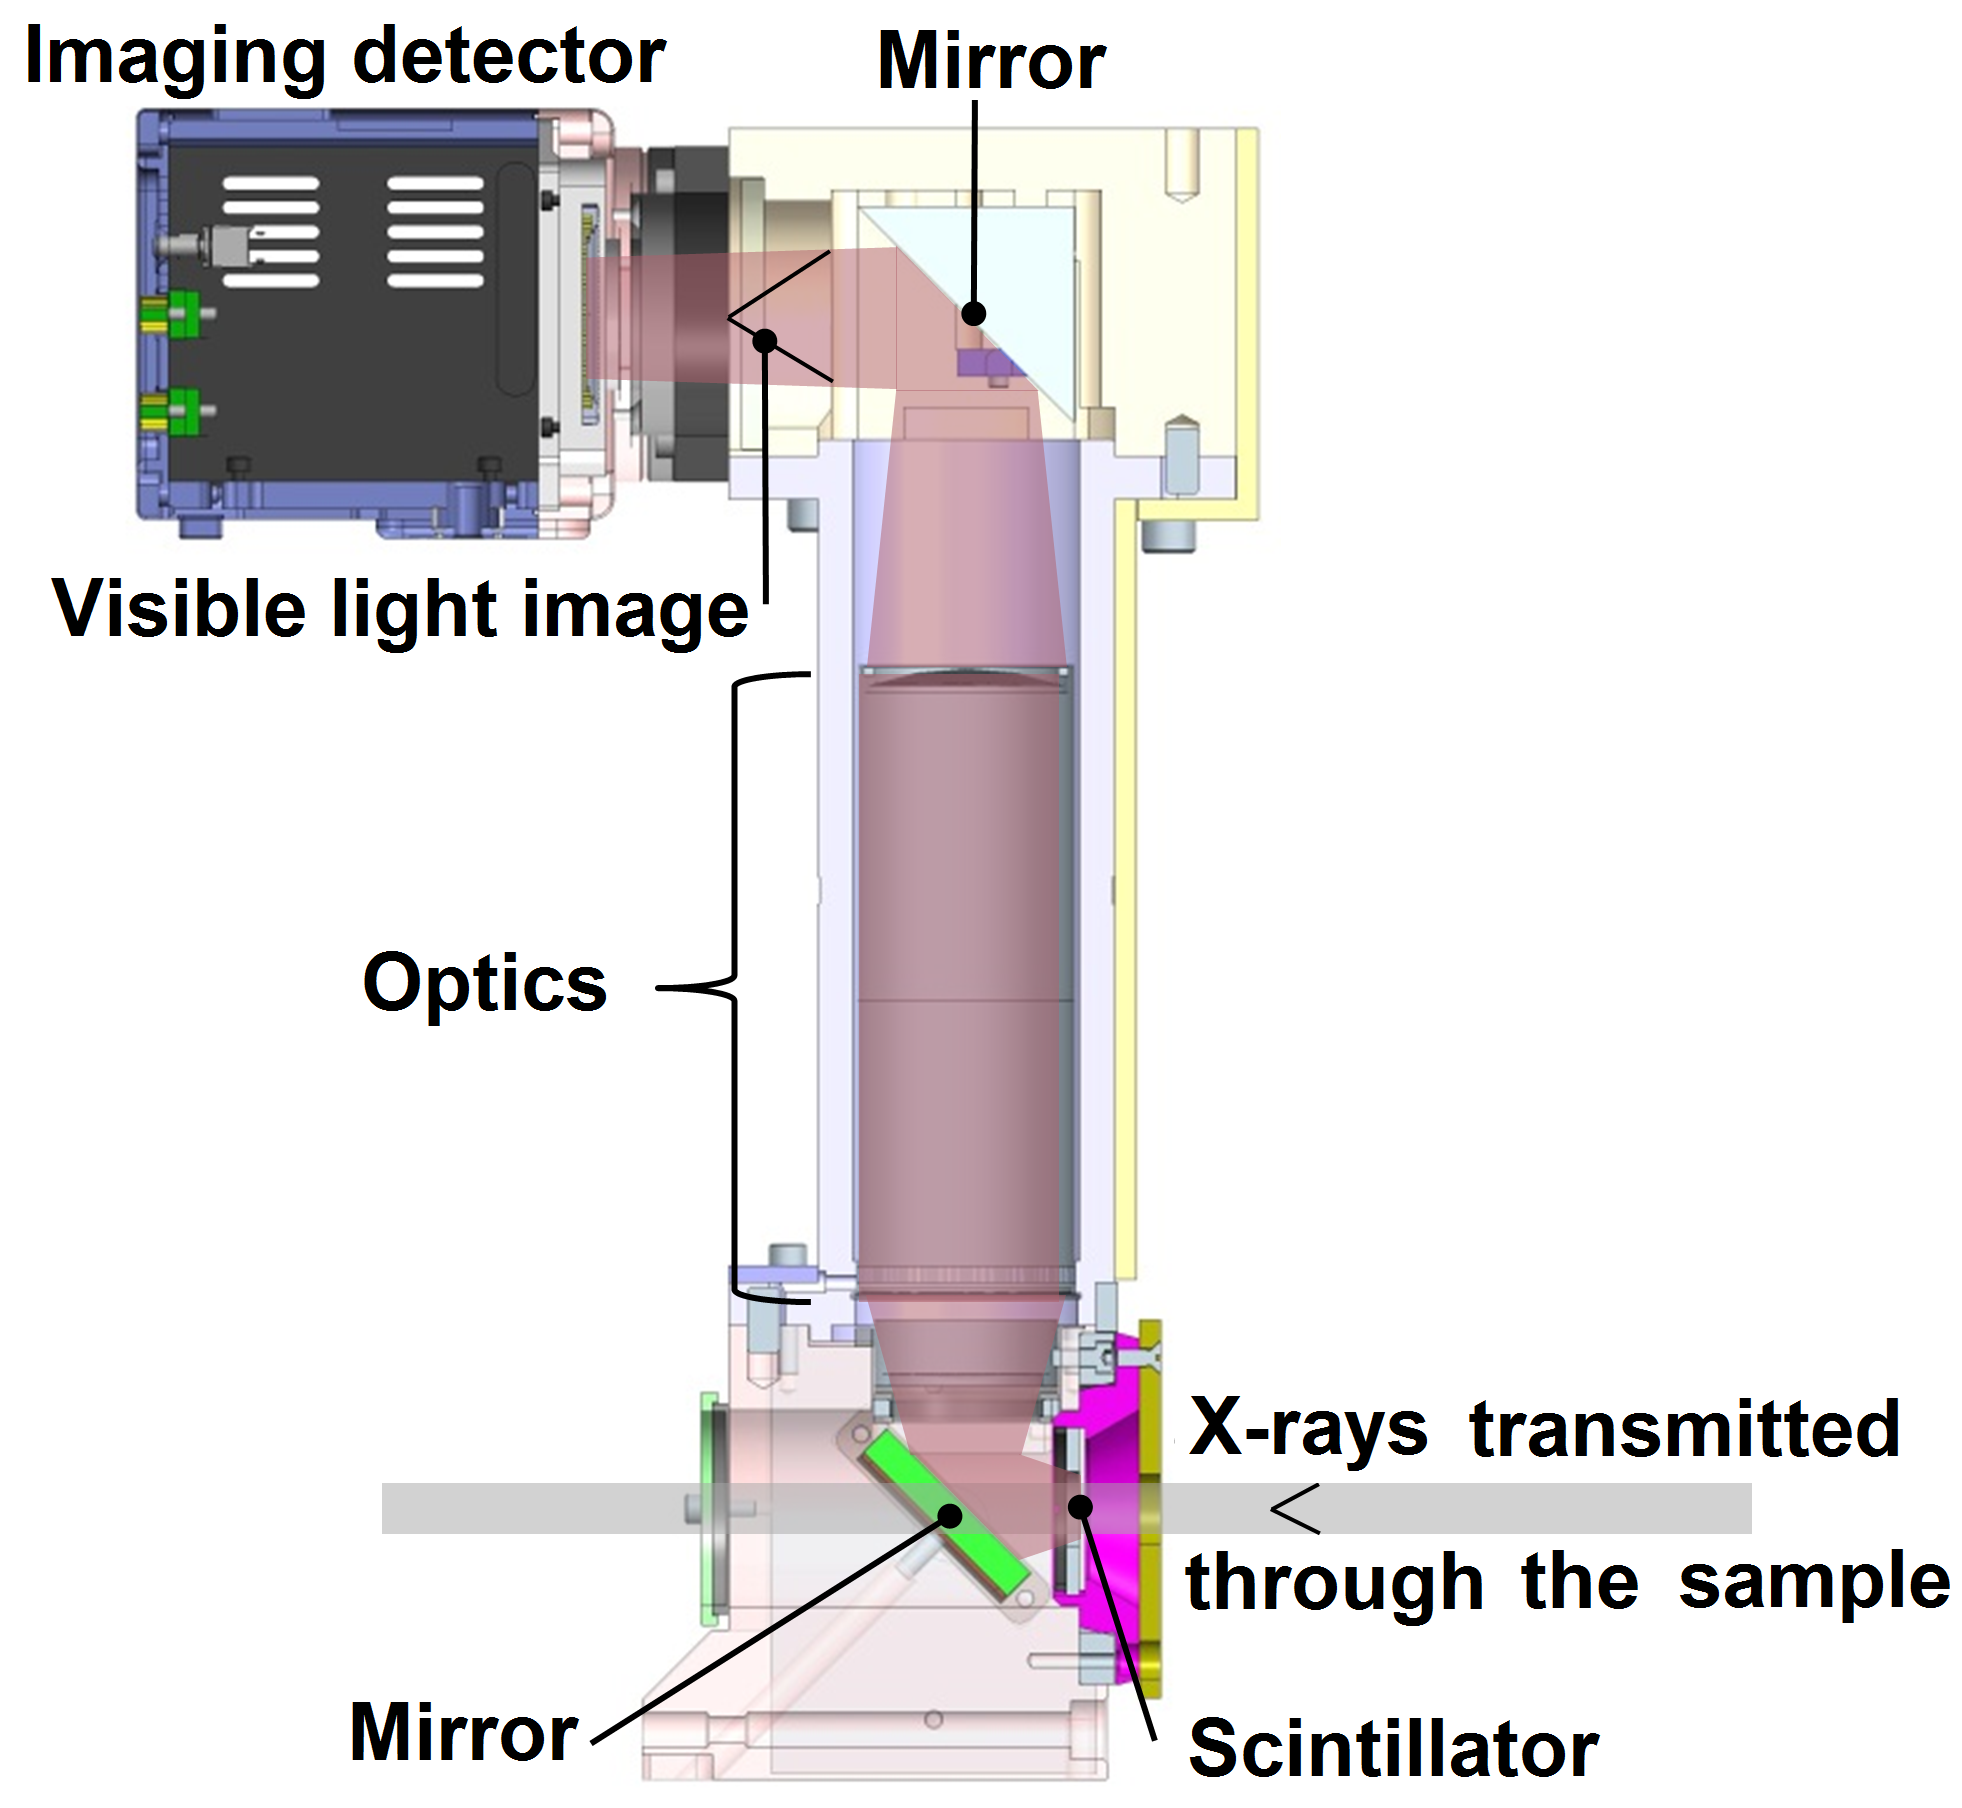
Schematic design of I12 optical modules used with imaging detector. X-rays enter an optics module (bottom right). Visible light image is generated in the scintillator and imaged onto an imaging detector (top left). The visible light path is folded twice. Imaging detector (= sensor) is a high resolution imaging camera PCO.Edge or a high speed imaging camera MIRO 310M.
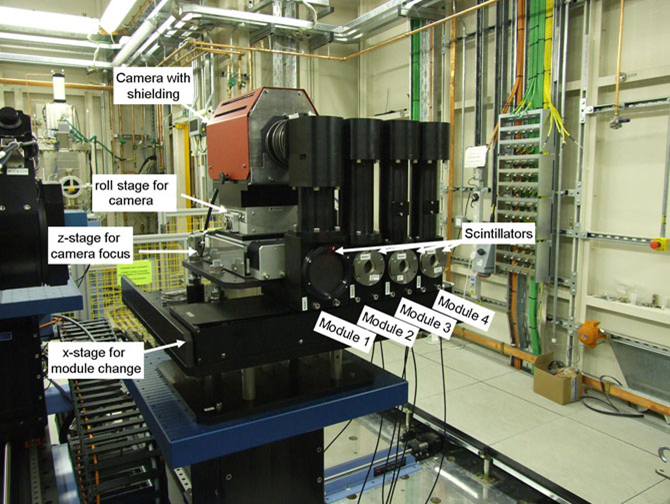
X-ray Imaging Camera. The resolution is increasing from Optical module 1 to Optical module 4 while the field of view decreases.
2. High resolution configuration of the imaging camera
Main characteristics of the PCO.edge visible light sensor used for high resolution imaging:
- Technology: sCMOS
- Simultaneously deliver low noise, wide dynamic range, high quantum efficiency
- Frame rates up to 100 frames/second (the actual frame rate depends on the exposure time required for your sample)
- Reduced vertical frame size can allow higher frame rate
- High resolution sensor of 2560 × 2160 pixels
- Exposure time: 0.5 ms to 2 s
- Monochromatic beam only
- Available for experiments in EH1 and EH2.
3. High speed configuration of imaging camera
Main characteristics of the MIRO 310M visible light sensor used for high speed imaging:
- Technology: CMOS
- 1280 x 800 pixel
- Fast frame rates – useful rate up to 3200 frames/second at full resolution. Higher speeds are possible for smaller regions of interest on the sensor, limited by available photon flux. As a guide, up to 10 000 frames/second are achievable (actual frame rate depends on the exposure time required for your sample and detector cropping)
- Minimum frame rate 24 frames/second
- Installed memory: 12GB
- Flash memory module: 250GB
- Exposure time: 1 µs – 41 ms
- White beam or monochromatic beam
- Available for experiments in EH1 and EH2.
During high speed recording using the MIRO camera, data are stored directly to the camera's on-board memory (12 GB), and once an experimental image series is complete, the images are read out to the central storage or the on-board flash module (250 GB). During downloading from any on-board storage to Diamond’s central storage, recording is not possible. Downloading of the images is often a limiting factor and must be considered in planning the experiment. Downloading the full on-board memory of 12 Gb takes approximately 10 minutes. At the maximum frame rate, the on-board 12 GB memory will be filled in about 3-4 seconds for any image dimension. Alternatively, the detector settings can be changed to give longer recording times. The frame rate can be adjusted independently of the exposure time. For example, images of 640 x 480 pixels may be recorded at 1 000 frames/second for 25 seconds before the memory becomes full (instead of 2.5 seconds at 10 000 frames/second). Images of 1280 x 800 pixels will be recorded at 1000 frames/second for 7.5 seconds. Please remember that the useful recording speed may be limited by the available X-ray flux and will depend on the magnification required as well as your sample’s attenuation: maximum frame rates may not allow good quality of image for your sample.
4. Using different optical modules with high resolution or high speed imaging detectors
The fields of view as well as the pixel scale depend strongly on the optical modules used with selected imaging camera.
The following table summarises these values for four optical modules with PCO.edge visible light sensor and with MIRO 310M visible light sensor (important: these two sensors cannot be used simultaneously). Note: these values are for guidance only.
| High resolution configuration (with PCO.edge visible light sensor) | High speed configuration (with MIRO 310M visible light sensor) | |||
|
Optical |
Field of view, hor × ver [mm] | Pixel size [square shape, µm] | Field of view, hor × ver [mm] | Pixel size [square shape, µm] |
| Module 1 | EH1: 46 × 12; EH2: 46 × 20 | 18.53 | EH1: 46 × 12; EH2: 46 × 20 | 38.10 |
| Module 2 | EH1: 20 × 12; EH2: 20 × 17 | 7.91 | EH1: 20 × 12; EH2: 20 × 20 | 16.26 |
| Module 3 | 8.0 × 7.0 | 3.24 | 8.5 × 5.3 | 6.67 |
| Module 4 | 3.3 × 2.8 | 1.30 | 3.4 × 2.1 | 2.67 |
Usual measurements time per one tomography rotation for monochromatic beam. Note: these values are for guidance only.
| Experimental Hutch 1 | Experimental Hutch 2 | |||
|
Optical |
High resolution imaging with PCO.edge | High speed imaging with MIRO 310M | High resolution imaging with PCO.edge | High speed imaging with MIRO 310M |
| Module 1 | < 1 min | 0.05 to 5 seconds | 5-10 mins | 18 seconds or more, limited by stage speed of Large Sample Table in EH2 |
| Module 2 | 1-2 min | 0.05 to 5 seconds | 5-10 mins | |
| Module 3 | 1-5 min | < 10 seconds | 10-20 mins | |
| Module 4 | 15-40 min | 10 seconds | n/a * | |
* Tomography in EH2 using optical module 4 is affected by the eccentricity of the Large Sample Table.
Selecting monochromatic or white beam for high speed imaging with MIRO 310M depends on the attenuation of your sample.
It is possible to use a filtered white beam to gain higher speed, however the contrast and the image quality will be decreased.
Imaging detector with Large Field of View (LFoV camera)
The Large Field of View camera is housed in Experimental Hutch 2 and enables radiography and tomography of large samples.
The field of view of LFoV camera is approx. 97 × 25 mm, where imaging quality is better in the central 18 mm vertically, due to the inherent vertical beam profile of the X-ray source. The pixel size of LFoV camera is 21.5 microns.
The Large Field of View camera incorporates two PCO.Edge imaging detectors viewing two sections of one scintillator. The images from these two imaging detector are aligned and stitched together to achieve one large image.
Typical time for one tomography rotation depends on the attenuation of your sample and can vary from 2 minutes to 2 hours.
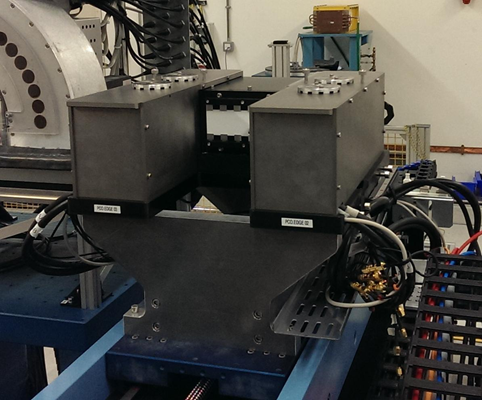
Large Field of View (LFoV) camera installed in EH2 on the Large Detector Table 2 (Module 1). Two PCO.edge cameras are shielded by tungsten plates.

Diamond Light Source is the UK's national synchrotron science facility, located at the Harwell Science and Innovation Campus in Oxfordshire.
Diamond Light Source Ltd
Diamond House
Harwell Science & Innovation Campus
Didcot
Oxfordshire
OX11 0DE
Copyright © Diamond Light Source. Diamond Light Source® and the Diamond logo are registered trademarks of Diamond Light Source Ltd
Registered in England and Wales at Diamond House, Harwell Science and Innovation Campus, Didcot, Oxfordshire, OX11 0DE, United Kingdom. Company number: 4375679. VAT number: 287 461 957. Economic Operators Registration and Identification (EORI) number: GB287461957003.