I14 Contact
I14 Control room:
Tel: +44 (0) 1235 778570
Principal Beamline Scientist:
Majid Kazemian
Email: [email protected]
Tel: +44 (0) 1235 778222
Science Group Leader
Julia Parker
Email: [email protected]
Tel: +44 (0)1235 778924
I14 Hard X-ray Nanoprobe
Status: Operational
Beamsize: 50nm x 50nm
Energy: 5 - 20 keV
Energy: 5 - 20 keV
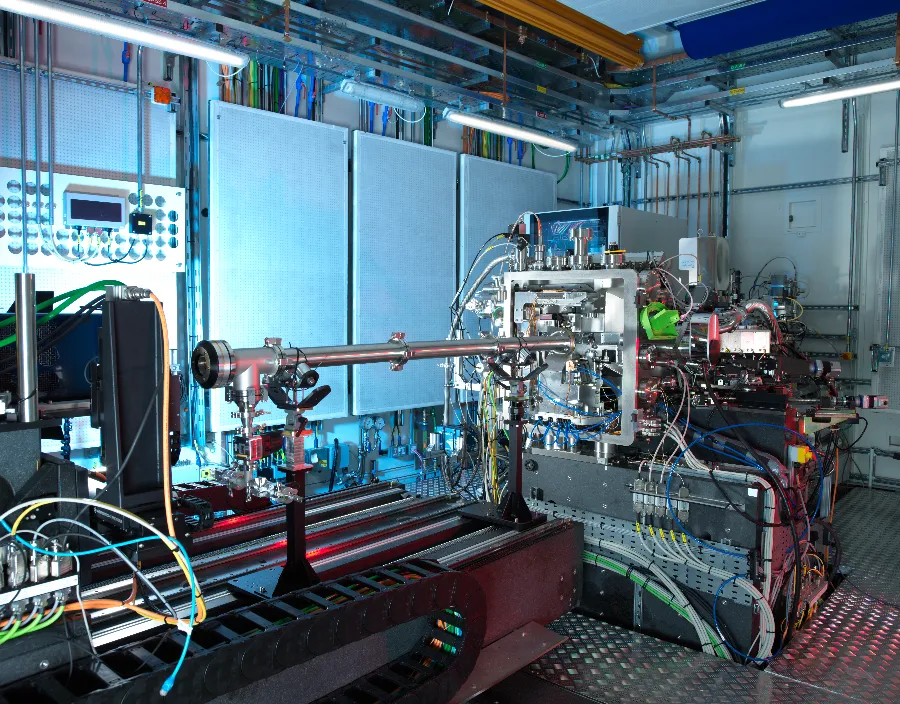
I14: Hard X-ray Nanoprobe
The Hard X-ray nanoprobe beamline is a dedicated facility for nanoscale microscopy and welcomed first users in March 2017. The nanoprobe provides a flexible endstation, with a beam size of 50 nm, optimised for scanning X-ray fluorescence, X-ray spectroscopy and diffraction. To maximise the distance from the focusing optic to the sample, the beamline extends beyond the main building to a distance of approximately 185m, and is housed in an external building alongside the eBIC and ePSIC national electron microscopy facilties.
I14 provides:
- Spatial resolution down to 50nm
- Wide energy range (5-20 keV)
- Raster scanning capability for fast acquisition and increased sample area coverage.
- XANES mapping capability
- Sparse XANES scanning with automatic data completion for faster acquisition and reduced dose
- Differential phase contrast imaging
- Ptychography
- Simple data acquisition software with a strong emphasis on fast post acquisition data processing
For more information on the beamline you can also see the beamline paper: (IUCr) The Hard X-ray Nanoprobe beamline at Diamond Light Source.
.png)
- A collection of dried coccolithophore microalgae, as seen by combined XRF and DPC imaging.
- Image courtesy of Dr. D. Chevrier (Faivre Group/BIAM), CEA Cadarache, France in collaboration with Dr. A. Scheffel, MPI Molecular Plant Physiology
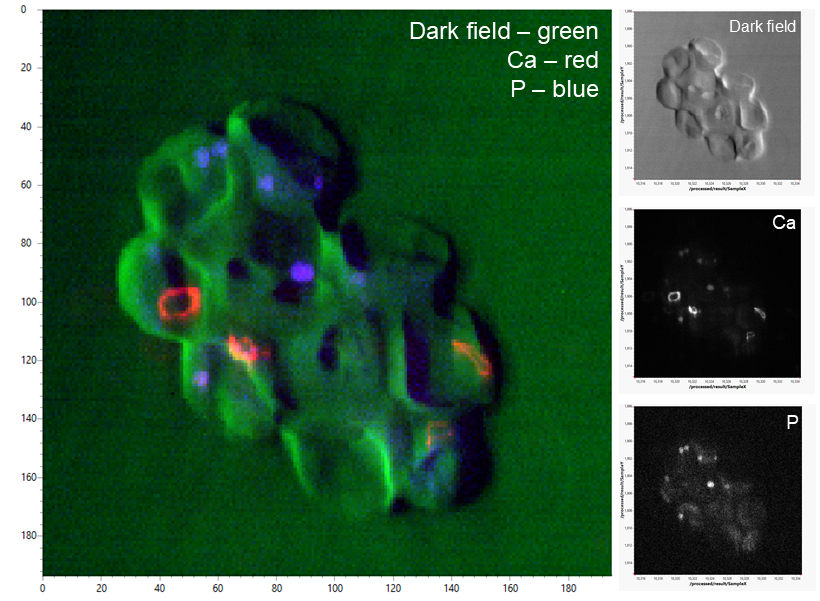
2D elemental mapping at 50 nm spatial resolution provides information on the chemical composition and elemental distribution in the sample. Additional information can be obtained by simultaneously acquiring imaging data.
More information on Beamline techniques - XRF.
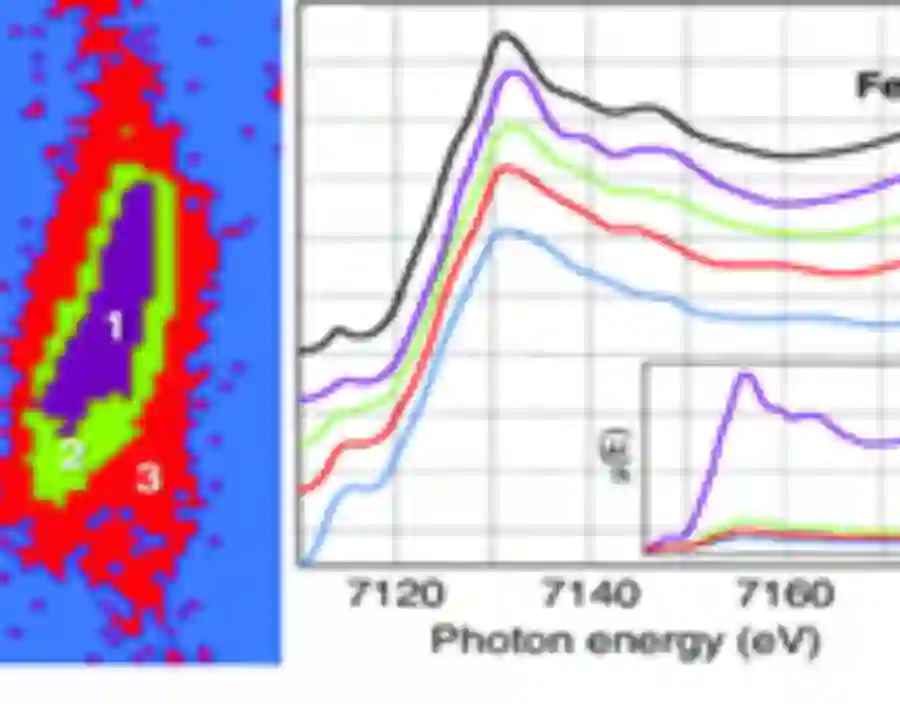
- 9-Energy X-ray fluorescence microscopy of ZnO nanorods after in-situ 1-hour incubation in a simulated sludge (humic acid 10 mg L-1)
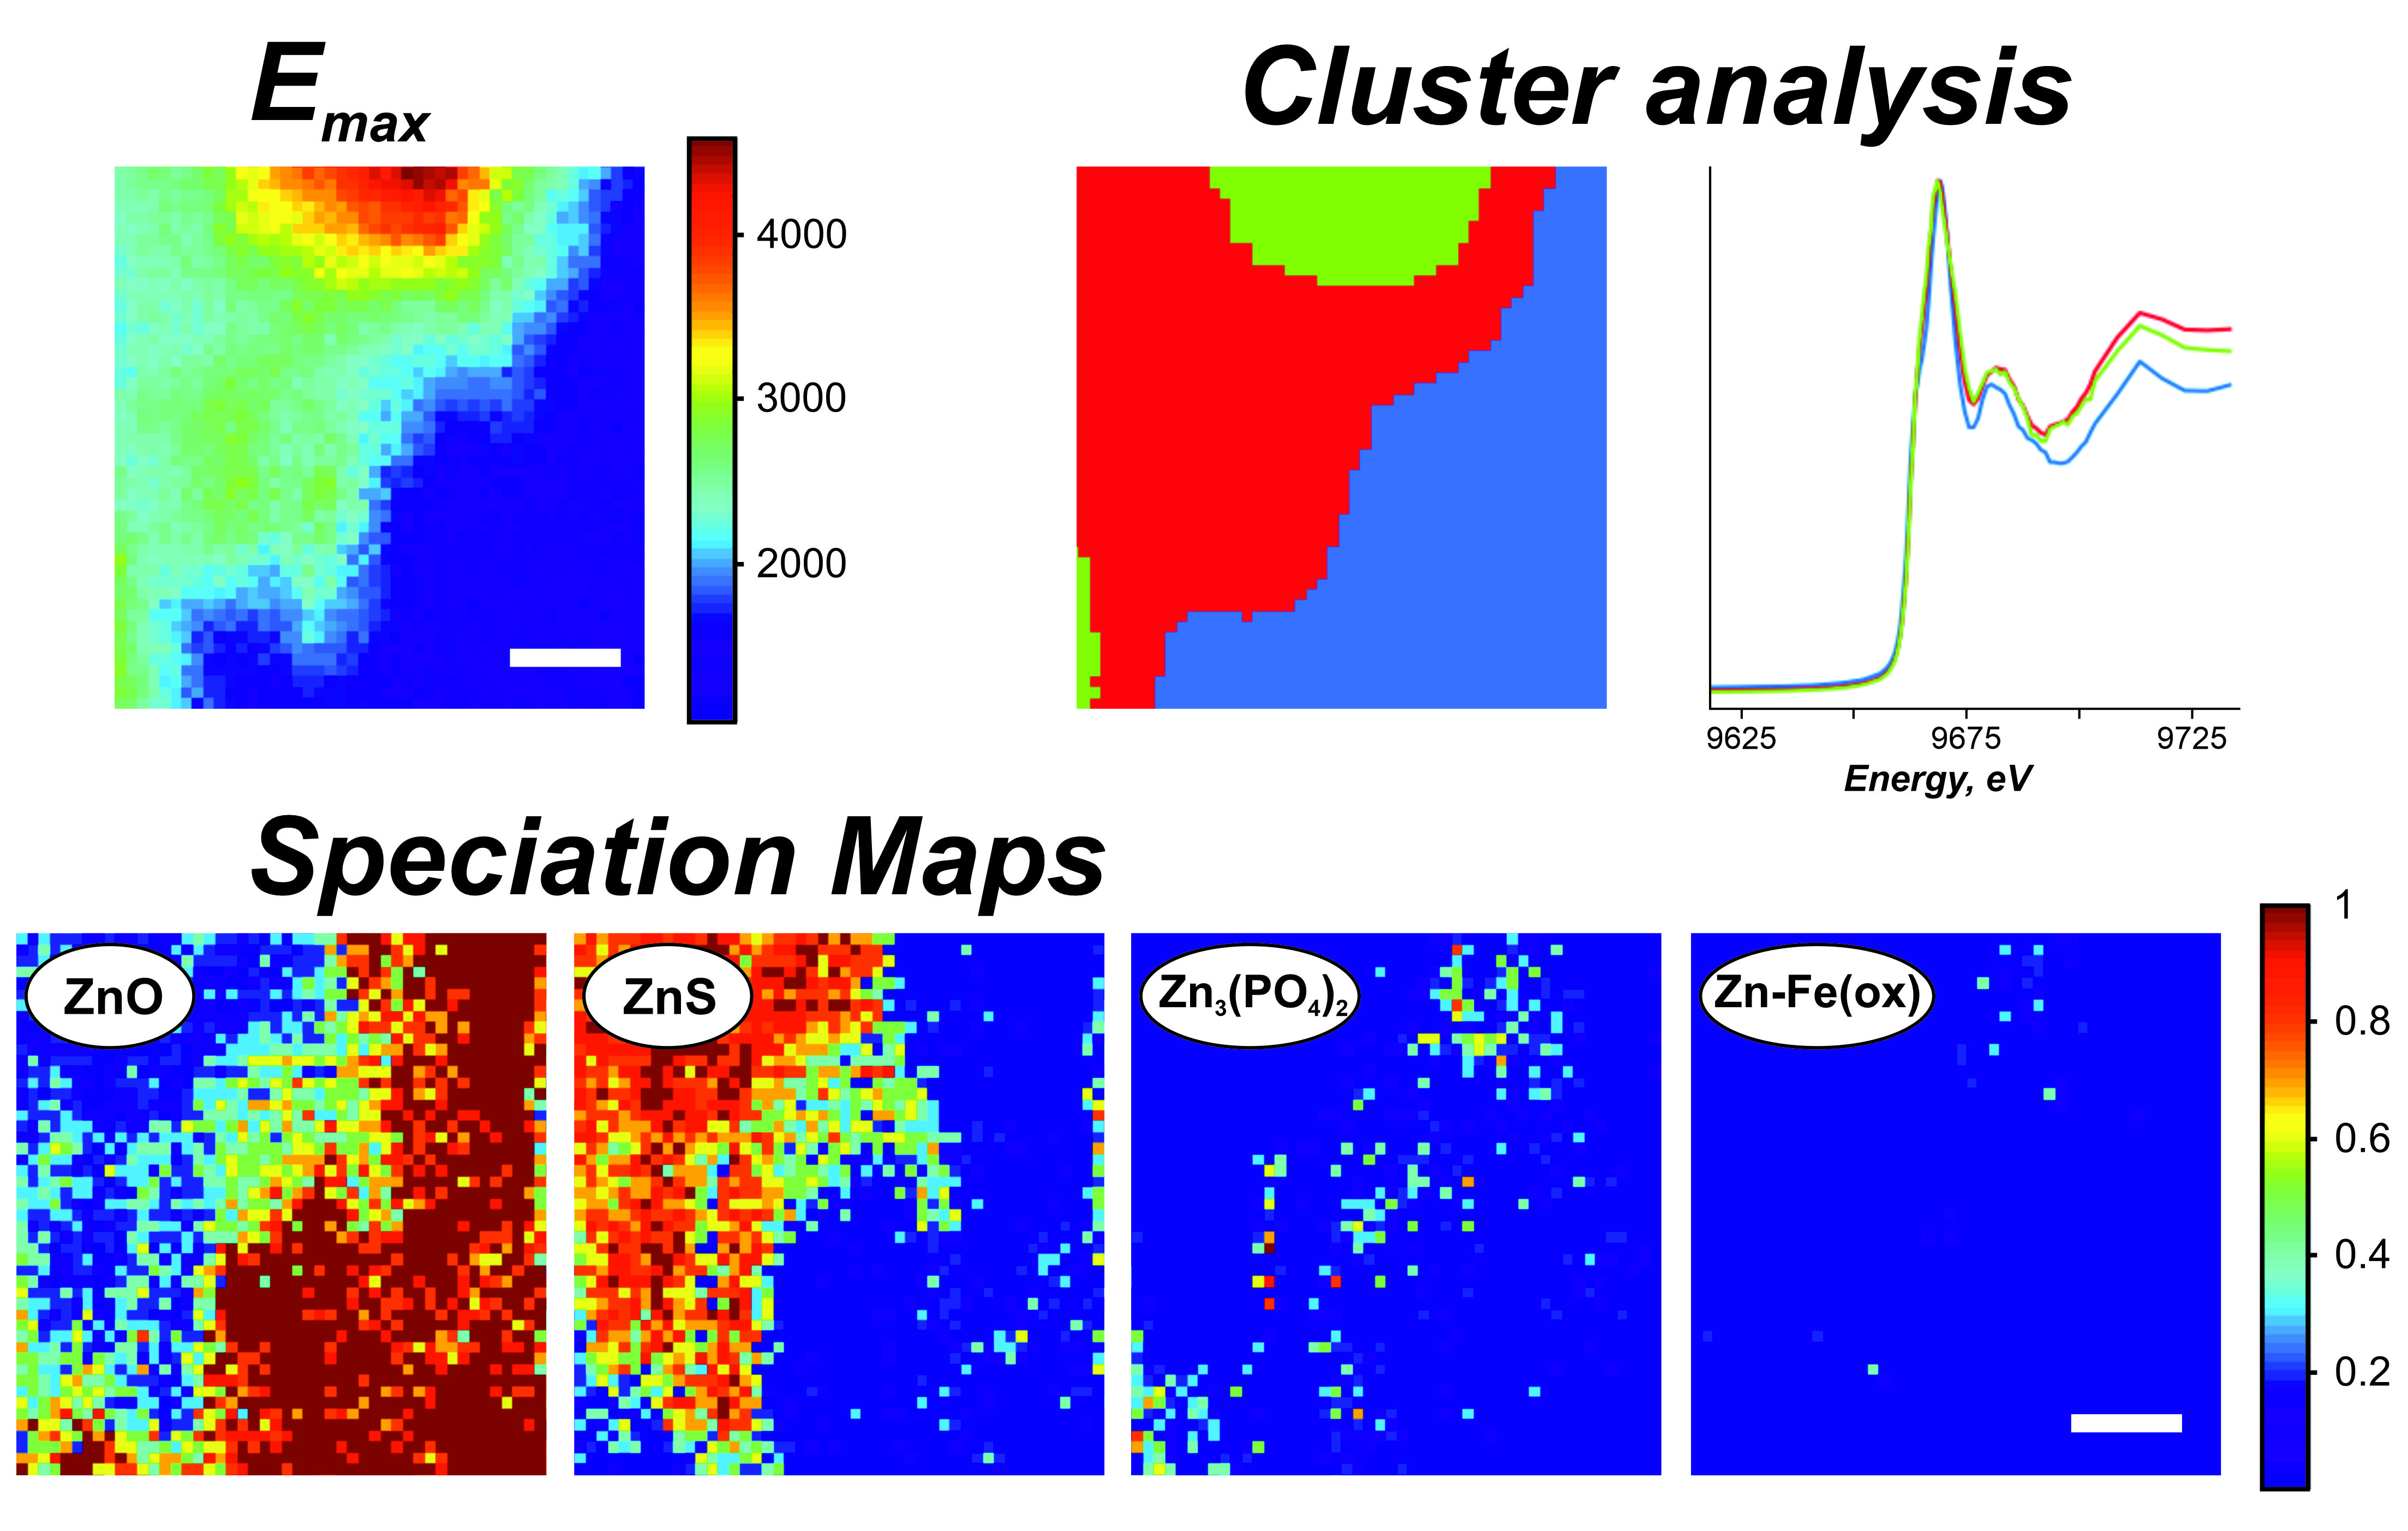
- Fluorescence map acquired at the maximum of Zn K-edge XANES spectrum (Emax=9669 eV).
Cluster analisys revealing three main regions according to their Zn K-edge XANES spectra.
Speciation maps of the expected Zn-species: ZnO, ZnS, Zn3(PO4)2 and Zn adsorbed to Fe-oxyhydroxides (Zn-Fe(ox)) (from left to right),
where the red colour equals a 100% compound contribution and the blue colour corresponds to 0%
The numbering on the scale bars on the fluorescence map represent fluorescence intensity (arbitrary units). Scale bars equal to 750 nm in all cases.
DOI: 10.1021/acsnano.9b02866
Spatially-resolved X-ray Absorption Near-Edge Structure provides information on the chemical speciation of the element of choice.
Multivariate cluster anaylsis revealing statistically-similar regions acording to their XANES spectra, can be performed by the cross-platform python package - Mantis. By averaging data across pixels in each region, signals with greater signal-to-noise ratios can be obtained.
Speciation maps can be calculated through fitting the absorption data from each pixel to the linear combination of the standard spectra, representing the ratio between the expected species (Gomez-Gonzalez et al. 2019 - ACS Nano, 2019, 13, 11049–11061).
More information on Beamline techniques - XANES.
Spatially-resolved Extended X-ray Absorption Fine Structure provides information on the local chemical structure of the element of choice.
Similar to XANES, EXAFS experiments measures X-ray absorption maps at a number of photon energies. In addition to the ~150 energies for XANES, EXAFS measures at higher energies beyond the absorption edge.
In addition to the results obtained by interrogating the XANES data, analysis on the normalised spectra can provide details on the nearest neibour atoms and bonds of the element of choice.
More information on Beamline techniques - EXAFS.
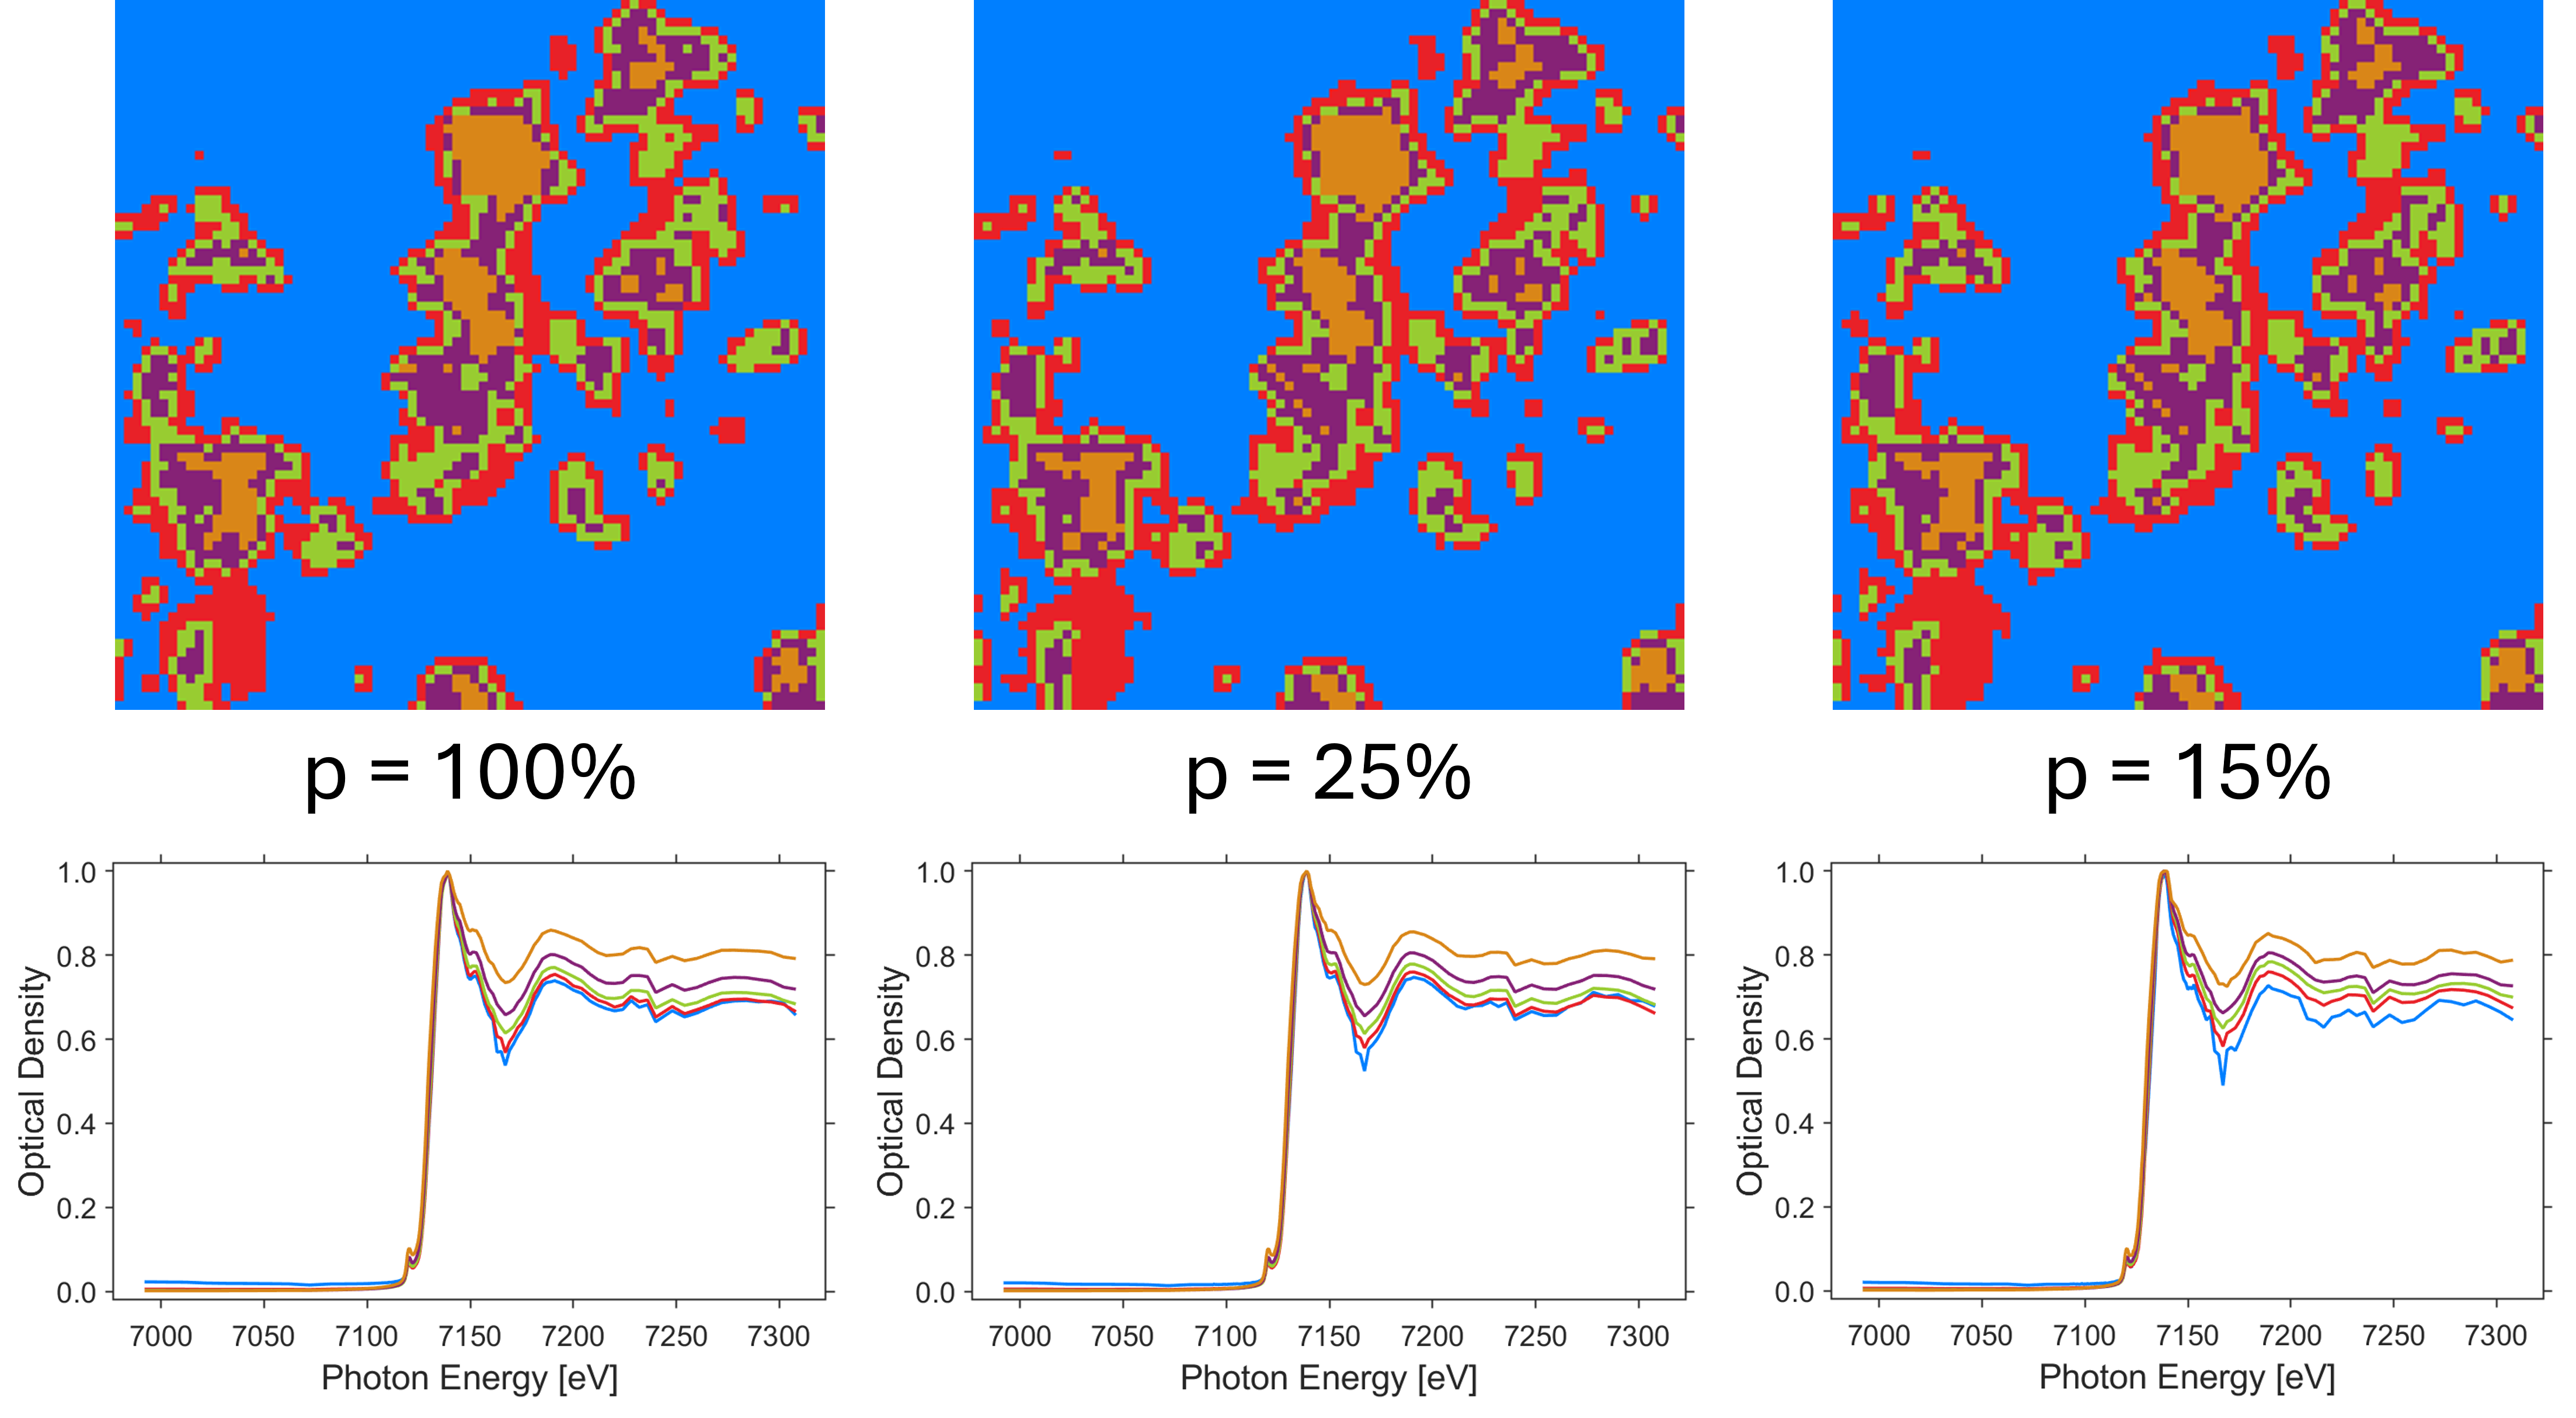
- Cluster analysis results of completed Fe XANES maps with different undersampling ratios (100%, 25%, 15%). Above are the cluster maps, illustrating the positions of each material, and below are the corresponding absorption coefficients. Each XANES experiment was performed in the same location after setting the undersampling ratio, the sparse data completed using LoopedASD, and the cluster analysis using MANTiS.
Sparse XANES and EXAFS experiments provide the same and information as regular XANES and EXAFS experiments, but in a fraction of the time and with a significantly reduced X-ray dose.
Long acquisition times and high exposure to X-rays restrict the wide spread application of XANES and EXAFS, especially to in-situ experiments and for unique, archaeological and biological samples. However, the low-rank structure of XANES/EXAFS data sets means that many of the measurements taken dureing experiments are redundant. Low rank matrix completion algorithms allow full data sets to be recovered accurately from only a small portion of known measurements.
We provide the option to perform Sparse Scanning experiments, in which a small number of rows are measured at each photon energy according to an automatically generated sparse scanning pattern. Full data sets are then recovered using a range of bespoke low rank matrix and tensor completion algorithms.
The underlying physical processes of the measurements taken, and later analytic approaches and software are identical to standard XANES/EXAFS experiments, as described in Beamline techniques – XANES, and Beamline techniques – EXAFS.
More information on Sparse Scanning and the completion techniques used, see Beamline techniques – Sparse Scanning. Images taken with permission of the authors of the article found here.
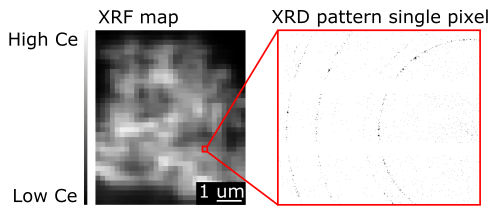
- XRD mapping at I14. XRF map, showing the Ce signal of a particle. For each pixel in this XRF image a corresponding XRD pattern is recorded, so that local variations in the crystalline structure can be studied.
- Diamond Light Source
X-ray diffraction (XRD) can be used to spatially map changes in crystallographic direction, d-spacing or strain across a sample. A 2D XRD pattern is collected per pixel, in concert with the XRF signal. Processing in 1D or 2D is later achieved through DAWN.
At I14, XRD mapping is available in both wide- and small- angle scattering geometry. The q range available is ~1-3 A for WAXS.
More information on Beamline techniques - XRD.
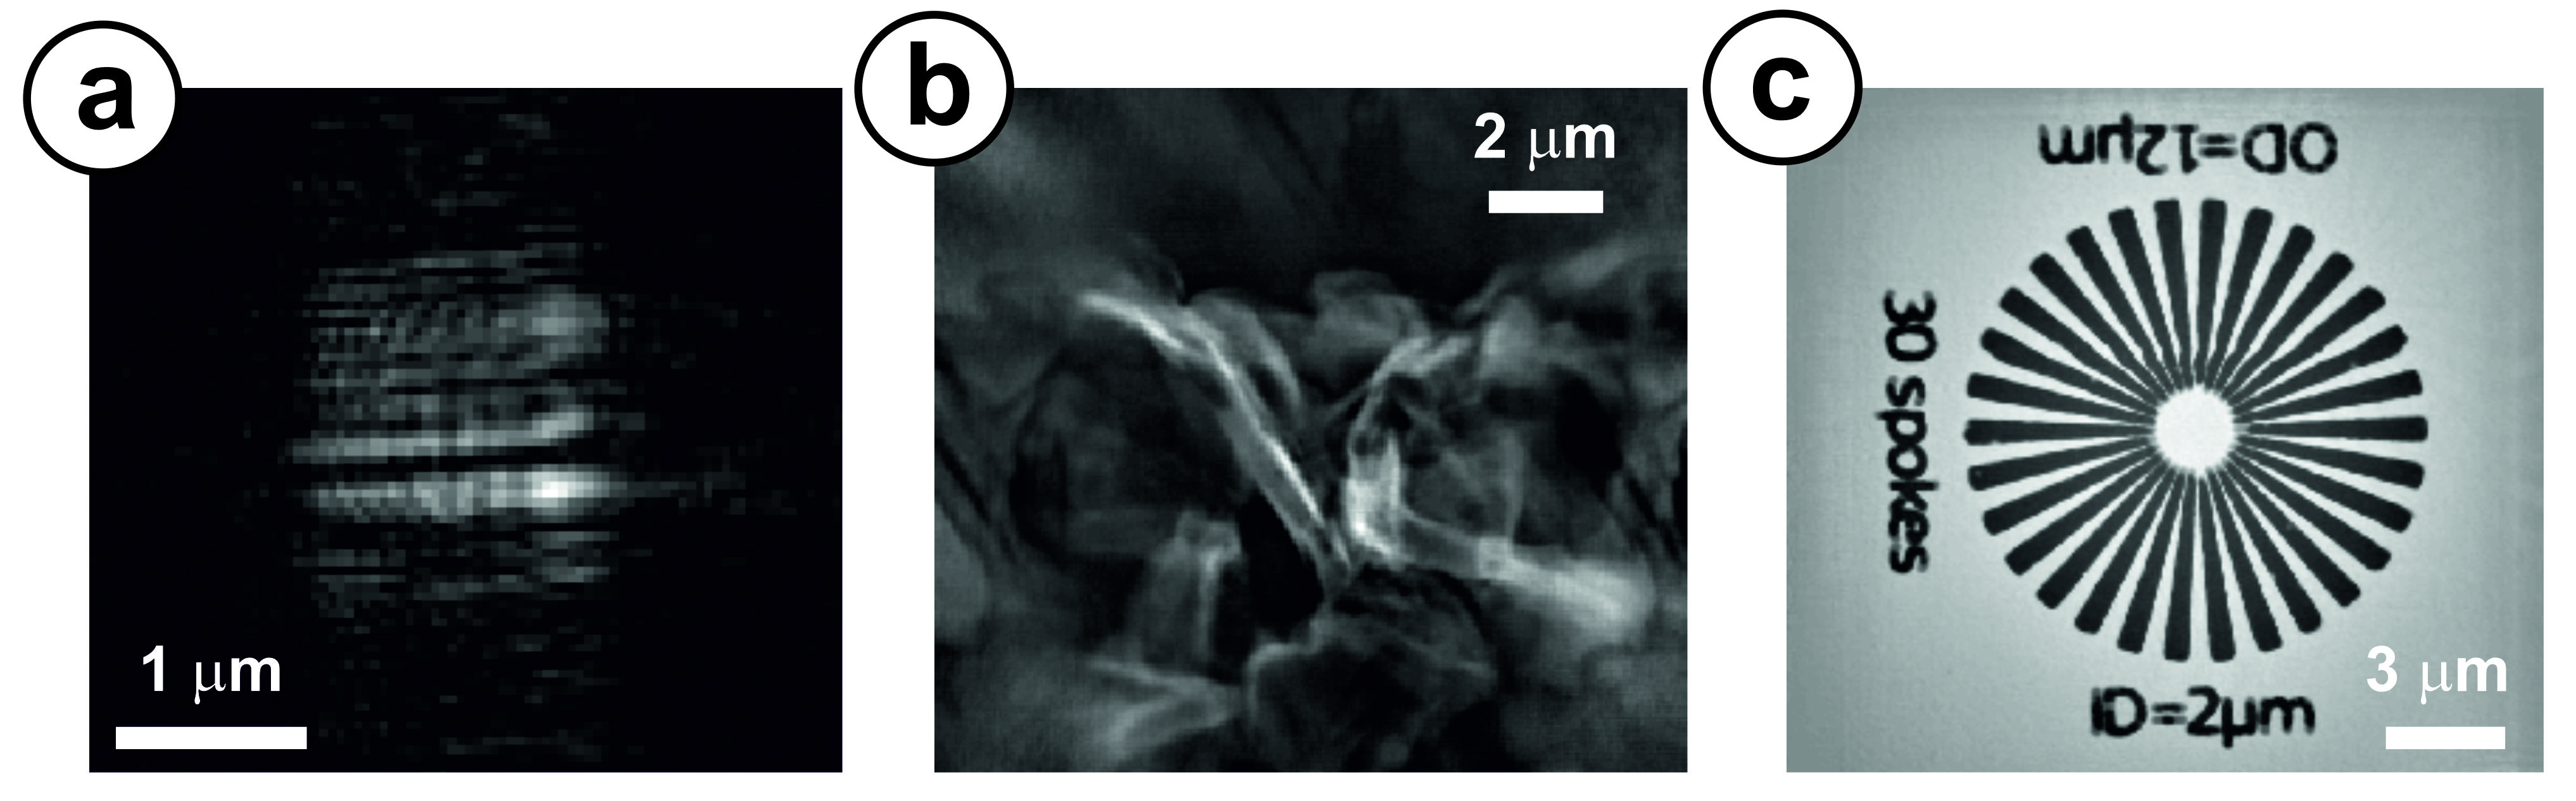
- Reconstruction of ptychographic data, recorded with monochromatic beam using the i14-MERLIN detector:
- (a) Probe modulus. Reconstructed probe size = 1.845 µm at 7.308 keV (800µm defocus)
(b) Object phase of a corroded Fe nanometric thin-film deposited onto a silicon nitride window. The reconstructed pixel size is 45 nm and the field of view is 16 × 16 µm2 at 7.308 keV.
(c) Object phase of a siemens star test sample, with radial markers representing ~100 nm line spacings.The reconstructed pixel size is 27 nm and the field of view is 18.3 × 18.3 µm2. Reconstructed probe size = 1.62 µm at 12 keV (800µm defocus).
X-ray ptychography imaging, which is a scanning coherent diffractive imaging technique, is now available at i14.
PtyREX, the reconstruction package for electrons and X-rays, was used for the processing and analysis of the ptychographic data. Each channel from the MERLIN detector was processed individually through 100 iterations of ePIE, with position correction and up-sampling.
More information on Beamline techniques - Ptychography.
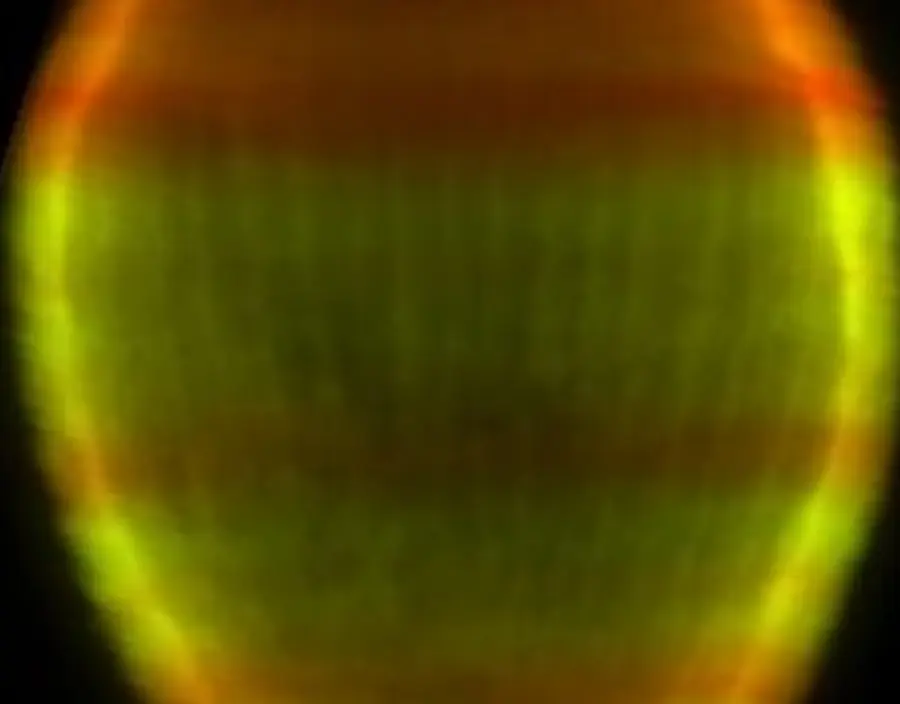
- 3D XRF of a Scyphosphaera apstenii coccolith showing the unique Sr banding structure, imaged at I14
Our tomography capabilities are currently in development at I14. We can combine any of the techniques available with tomography to map your sample in 3D.
Our most common use case is XRF tomography which allows us to display the elemental composition of a sample in 3D. Using DPC or ptychography, we can generate phase images in 3D giving density information. These techniques can be combined to give elemental analysis in context with lighter elements.
More information on Beamline techniques - Tomography.
More information re: image above can be found at:
https://doi.org/10.1039/D3EM00509G.
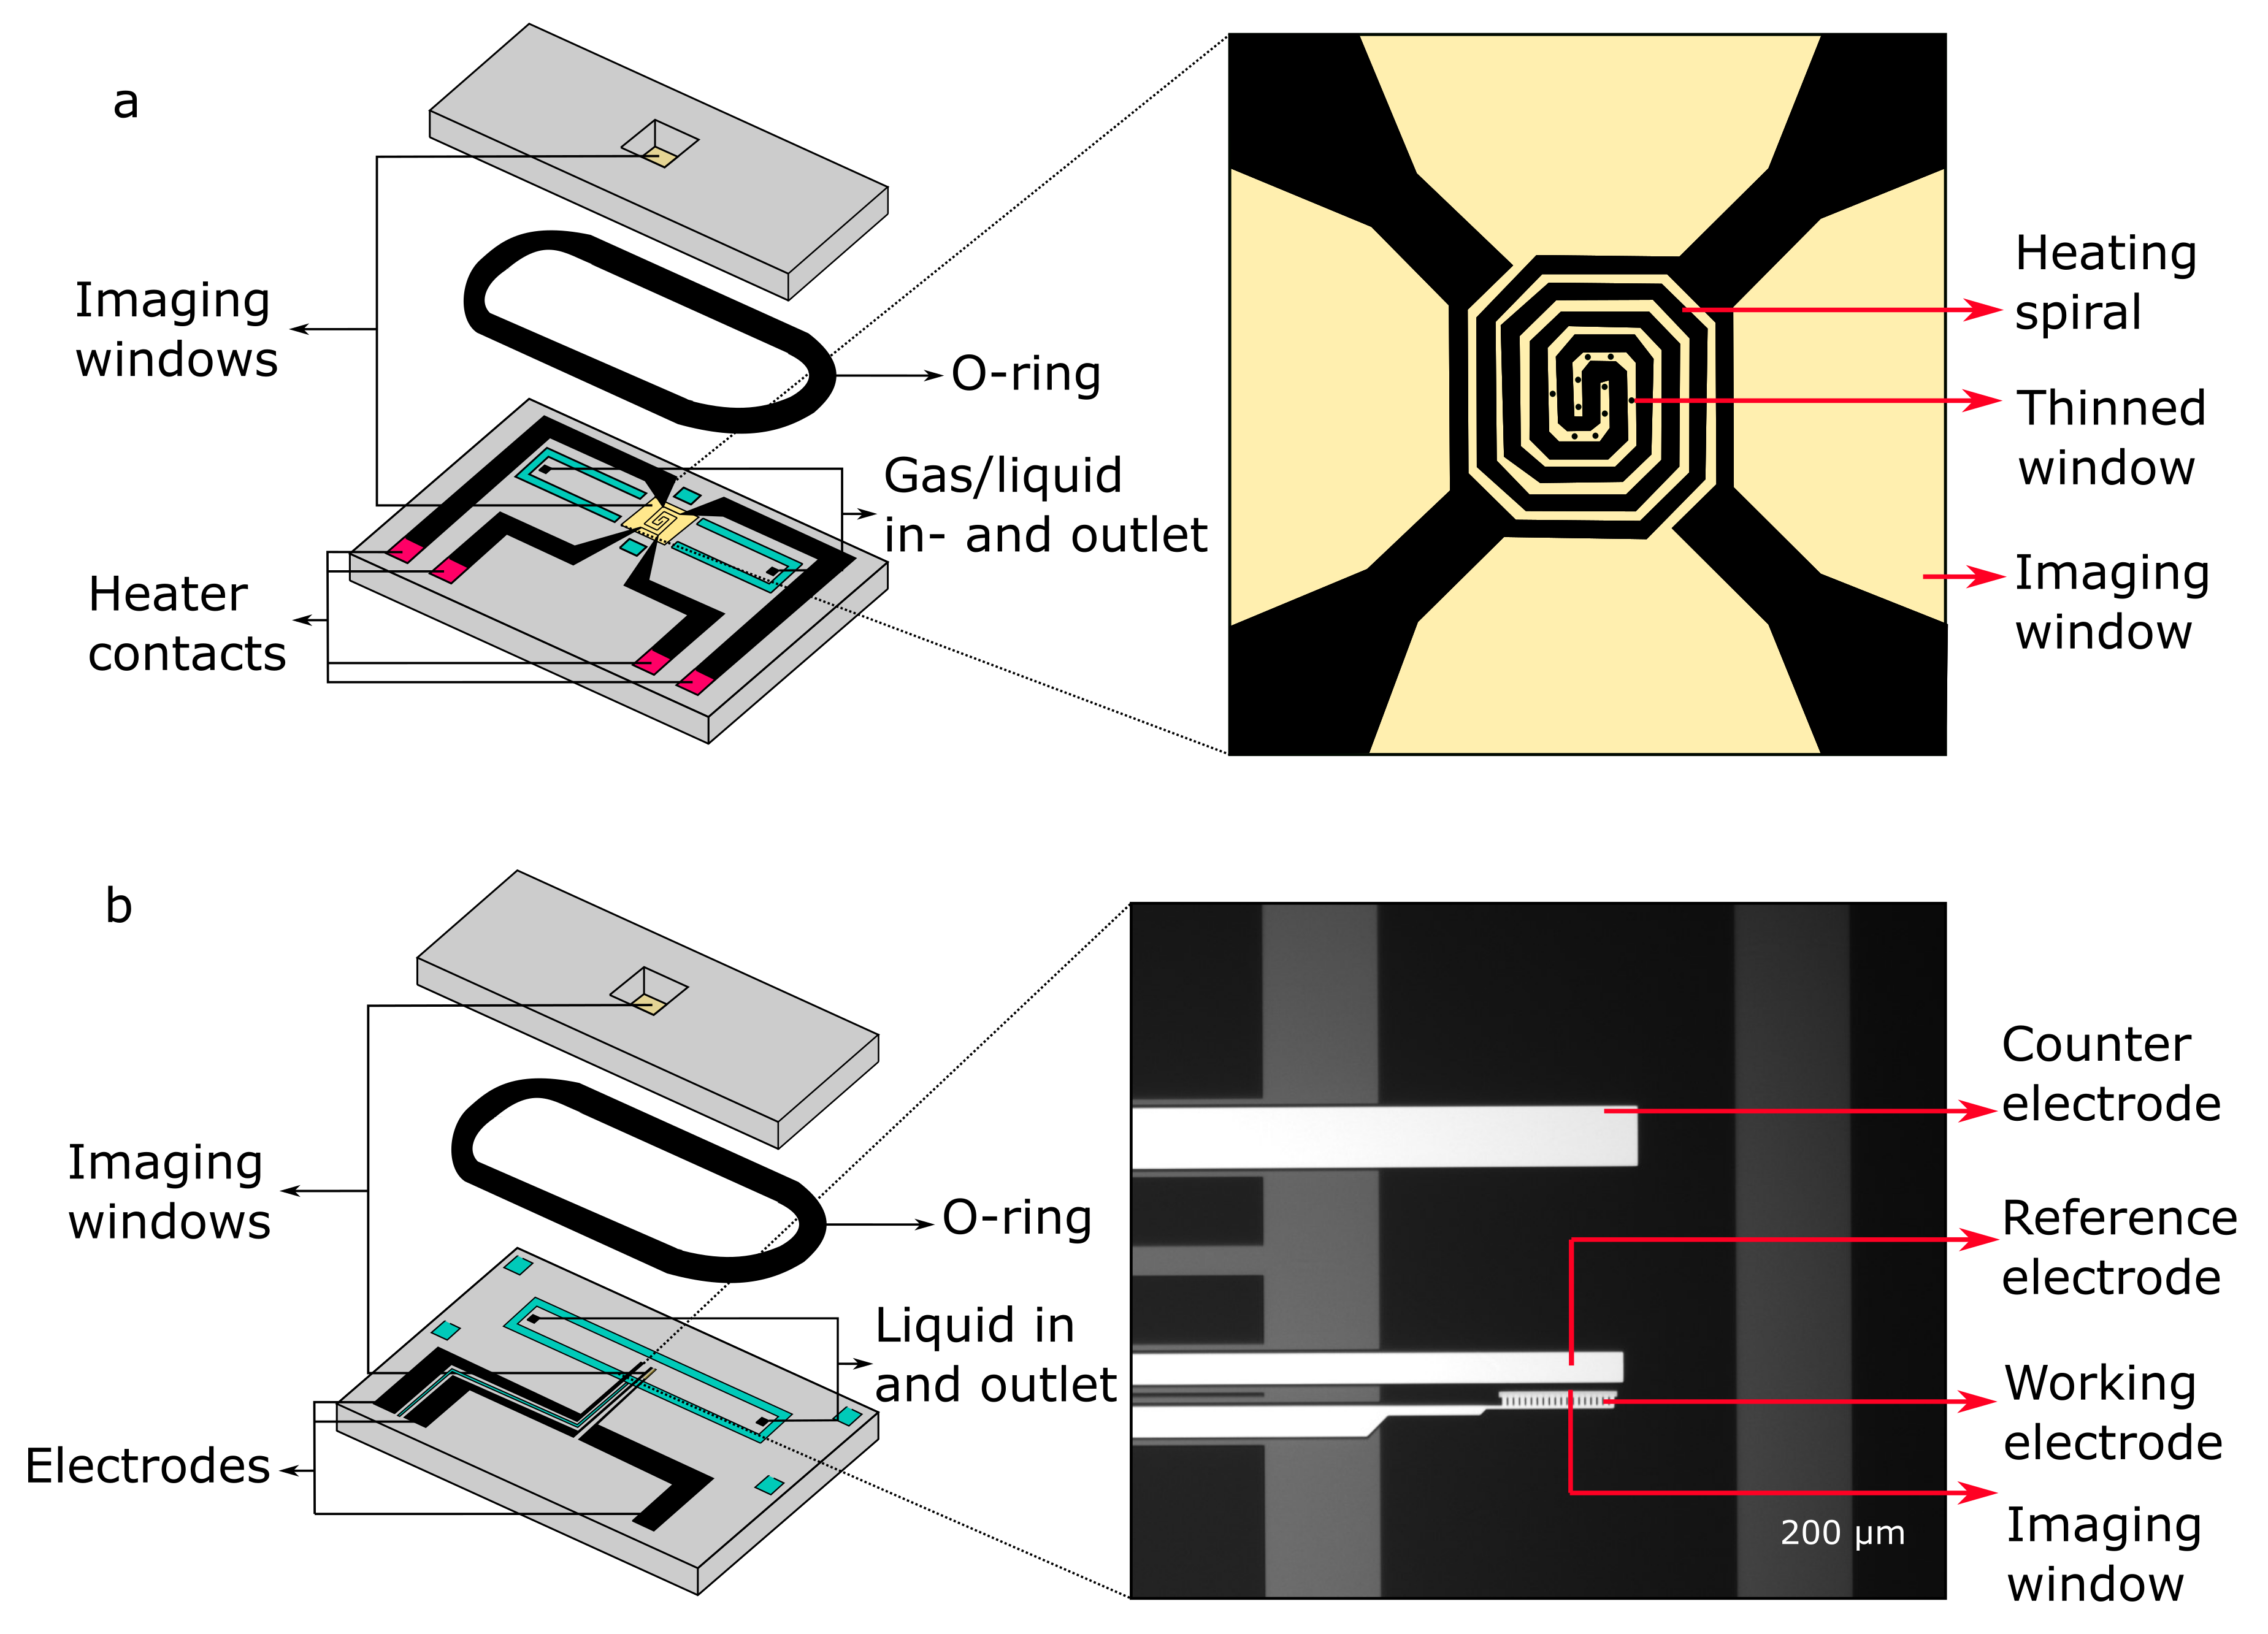
- Schematic of example in situ chips. a) DENSsolutions heating chip that can be used for gas or liquid flow. b) DENSsolutions biasing chip that can be used with liquid. https://doi.org/10.1080/09603409.2023.2213579
Gas flow: samples can be subjected to a mixture of up to three gasses.
Liquid flow: liquid can be flown into the holder through a syringe pump.
Heating: samples can be heated up to 1100℃.
Biasing: samples can be subjected to electric biasing using a three electrode system attached to a Biologic SP200 potentiostat.
A variation of in situ sample environments are available: any type of Protochips and DENSsolutions liquid chip, DENSsolutions gas chips, K-kit liquid TEM holders.
Read more on the Beamline research projects page In-Situ.
More information on Beamline techniques - In Situ.

Diamond Light Source is the UK's national synchrotron science facility, located at the Harwell Science and Innovation Campus in Oxfordshire.
Diamond Light Source Ltd
Diamond House
Harwell Science & Innovation Campus
Didcot
Oxfordshire
OX11 0DE
Copyright © Diamond Light Source. Diamond Light Source® and the Diamond logo are registered trademarks of Diamond Light Source Ltd
Registered in England and Wales at Diamond House, Harwell Science and Innovation Campus, Didcot, Oxfordshire, OX11 0DE, United Kingdom. Company number: 4375679. VAT number: 287 461 957. Economic Operators Registration and Identification (EORI) number: GB287461957003.