Instruments by Science Group
I19 Contact
Beamline Phone Number:
+44 (0) 1235 778418
Principal Beamline Scientist:
Dave Allan
Tel: +44 (0) 1235 778644
E-mail: [email protected]
Science Group Leader
Philip Chater
Email: [email protected]
Tel: +44 (0)1235 778677
I19 Small Molecule Single Crystal Diffraction
Status: Operational
Wavelength: 0.5 - 2.5 Å
Energy: 5 - 25 keV
Energy: 5 - 25 keV
Below is a summary for data collection but more details of each step can be found on the individual pages in this section.
1. Centring
Once the sample has been mounted on the goniometer, it needs to be centred.
Samples loaded by the robot are automatically moved to a position on the OAV2 camera which should be close to the cross-hair of the on-axis camera. It is possible to run the script for manually mounted samples by pressing the Pin Tip Centring button.
The sample mount is driven by left clicking on the crystal in the OAV view - this moves the stages to put the point clicked on, to the cross-hair. The crystal can be measured (in microns) by left-clicking the mouse and dragging along the length.
Further information can be found on the Crystal Manipulation page.
2. Data files
Once the crystal is centred and measured, change to the Data Collection Input tab.
All data will be collected within your visit directory and only users identified on the visit in the UAS will have access to this data.
The top left of the form shows which visit the data is being collected to, but you will need to identify the Default Folder and Default Prefix for each dataset.
Default Folder is where the images will be saved, and Default Prefix is the name which will be given to the images within that folder. Use a different folder for each dataset.
For samples registered in ISPyB, it is possible to use the information already provided to populate these places. By using the $ variables, this information can be picked up automatically for each sample without the need to type it in each time.
See the Data Location page for more information.
3. Screening
The first collection on a new sample is likely to be a screening run - this is the top line of any pre-defined run list loaded, and is a phi scan consisting of 450 0.1° images. Click on Row Sel. in the table to highlight this row and then click on Run Selected to collect these images.
The default transmission for screening is set to 1% but this can/should be adjusted in the table once you have a feel for what an appropriate level is likely to be.
Samples are screened to judge the best level of attenuation as it is important to ensure reflections on the detector are not overloaded. The screening output includes a histogram plot showing the spot intensity distribution and the percentage transmission should be set so the histogram reaches no more than 25% of the maximum.
The output also provides a summary table of the exposure factor needed to reach various data resolutions - this should be used in conjunction with the histogram to decide the best attenuation level. It may be necessary to increase the collection time to obtain strong enough data to the required resolution as the detector threshold (25%) should not be breached.
Multiple screening runs may be needed to decide on the best attenuation level and they should be collected in separate directories.
The Screen19 page has further details on using, and interpreting, the results.
4. Data collection table
Use the screening results and diffraction images to decide which run list is most appropriate. For example, the default run list is designed to collect data out to 0.62 Å, but this may not be the best option if the crystal only diffracts to 0.8 Å. Delete any rows in the table and load the desired run list. See how to load Run Lists and details about available Strategies.
Use the screening results to set the transmission in the data collection table - the value set here is what will be used for each run.
Set the time per image - the default is 0.2 sec per 0.2° image (do not decrease the image width).
Once the data collection table is correct, press the shift key and click in the row select column to highlight the runs to be collected. Do not include the screening sweep in the selection.
Click on the Run Selected button at the top right of the table to add the data collection to the queue.
Stopping Data Collection
If you want/need to stop the data collection (or anything at any time, but NOT the robot):
Press the little round red button next to the word Stop All ![]()
This is located towards the centre of the bar at the very bottom of the GDA window
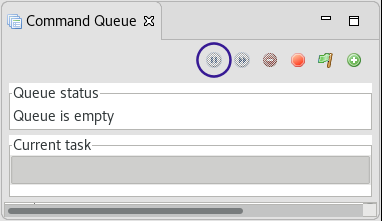
One side effect of the Stop All button is that it will pause the queue, indicated in the bottom right-hand corner of GDA with a paused status in red. The pause button in the Command Queue tab (in the purple circle, below) will turn into a play button and this should be pressed twice to get back to the Queue Waiting status). It is always necessary to restart the queue after a Stop All.

Diamond Light Source is the UK's national synchrotron science facility, located at the Harwell Science and Innovation Campus in Oxfordshire.
Diamond Light Source Ltd
Diamond House
Harwell Science & Innovation Campus
Didcot
Oxfordshire
OX11 0DE
Copyright © Diamond Light Source. Diamond Light Source® and the Diamond logo are registered trademarks of Diamond Light Source Ltd
Registered in England and Wales at Diamond House, Harwell Science and Innovation Campus, Didcot, Oxfordshire, OX11 0DE, United Kingdom. Company number: 4375679. VAT number: 287 461 957. Economic Operators Registration and Identification (EORI) number: GB287461957003.