Instruments by Science Group
I19 Contact
Beamline Phone Number:
+44 (0) 1235 778418
Principal Beamline Scientist:
Dave Allan
Tel: +44 (0) 1235 778644
E-mail: [email protected]
Science Group Leader
Philip Chater
Email: [email protected]
Tel: +44 (0)1235 778677
I19 Small Molecule Single Crystal Diffraction
Status: Operational
Wavelength: 0.5 - 2.5 Å
Energy: 5 - 25 keV
Energy: 5 - 25 keV
It may be useful to check the output from the auto processing before reprocessing for advice on what to try in order to improve the results.
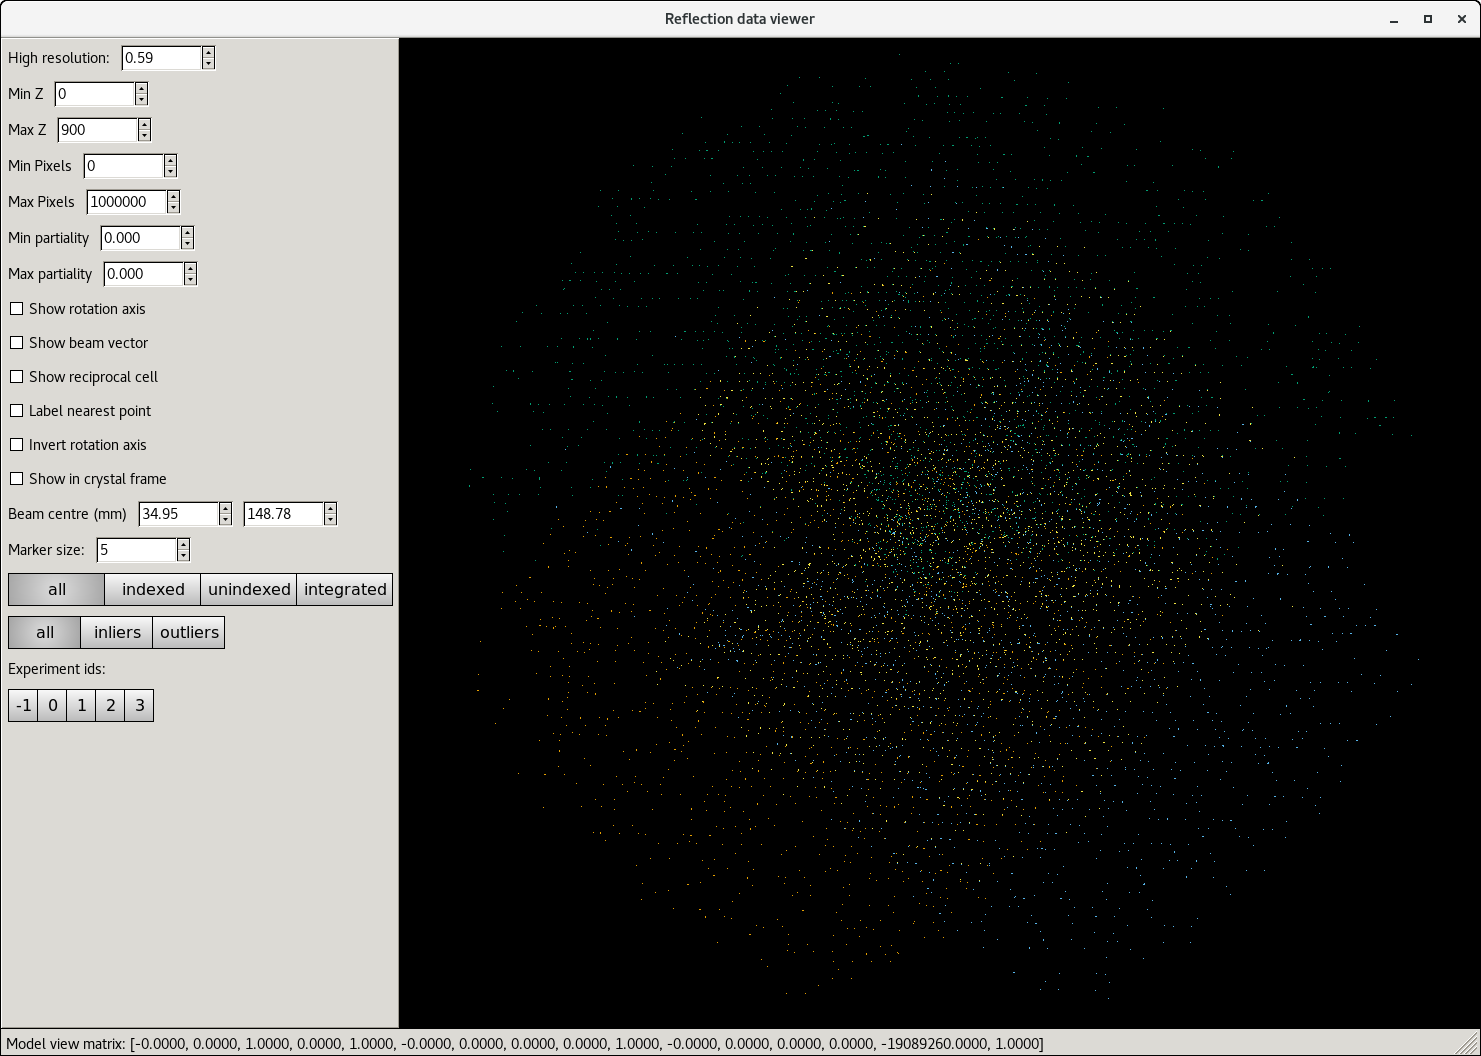
Check the Reciprocal Lattice
The reciprocal lattice view for individual runs can be seen easily using ISPyB, but the full dataset can be checked in a NoMachine session either on the beamline computer during beamtime or on the compute cluster after beamtime has ended. This is useful to show which runs have issues, or if it looks like the sample may have moved, etc.
Note: files in the tmp directory are only stored for 1 week but these files are reproduced during reprocessing.
dials.reciprocal_lattice_viewer requires an .expt file and the corresponding .refl file
Navigate to the run corresponding to the final sweep of the data collection in your visit directory, e.g. using the default run list for the sample, sugar, collected in cm28127-3
cd /dls/i19-1/data/2021/cm28127-3/tmp/zocalo/sugar/sugar_4
Although the folder is SWEEP1, the results from indexing all sweeps are actually here.
To see the reflections picked up from spot finding:
cd xia2-dials/xia2-dials/xsugar4/SAD/SWEEP1/index
If you have collected 4 sweeps of data, then the indexing results are numbered 17, but choose whichever files are titled indexed
dials.reciprocal_lattice_viewer 17_indexed.refl 17_indexed.expt
(shortcut type: dials.rec TAB)
If the data has failed to index, then all sweeps of data can be viewed toegther using:
dials.reciprocal_lattice_viewer 11_SWEEP4_strong.expt 11_SWEEP4_strong.refl 8_SWEEP3_strong.refl 8_SWEEP3_strong.expt 5_SWEEP2_strong.refl 5_SWEEP2_strong.expt 2_SWEEP1_strong.refl 2_SWEEP1_strong.expt
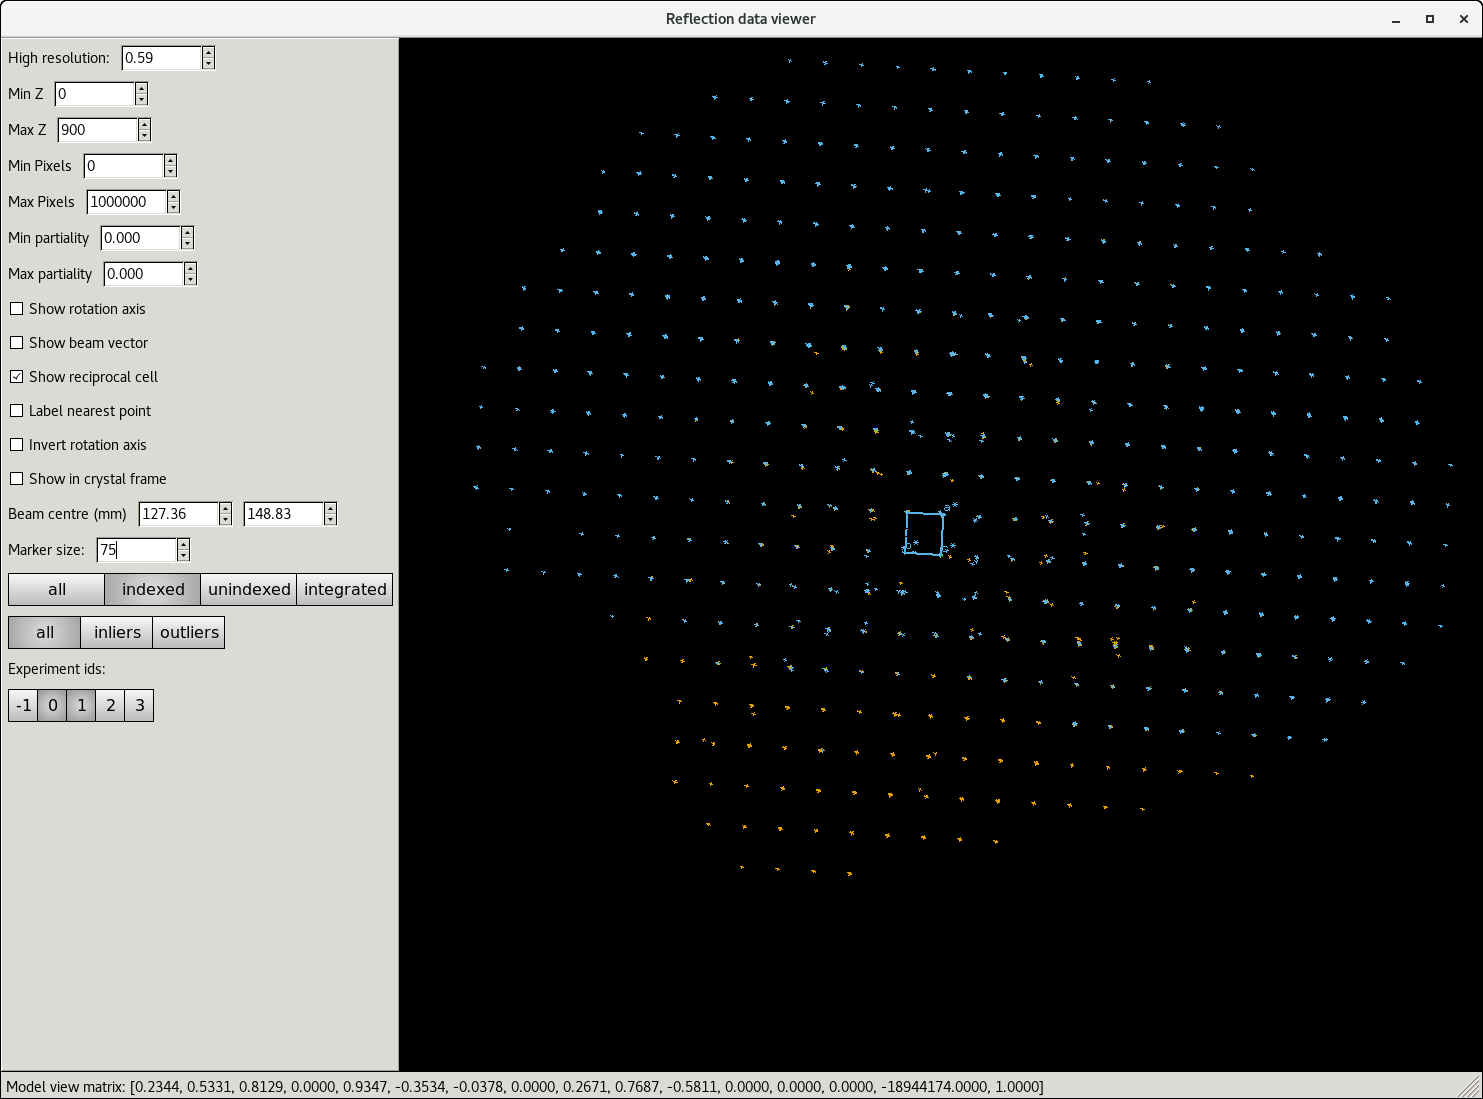
- Change the marker size from 5 to 50 - this makes the reflections easier to see and reduces the rotation speed to make lattice searching easier.
- Use the Experiment ids to show particular combinations of the sweeps (different sweeps are different colours)
- Switch between all, indexed and unindexed to check the indexing results
- Check the box to "show reciprocal cell" to see the indexing used
(Note that looking at the pair of files after scaling, in DataFiles does not work properly, so the fit always looks bad.)
Check the Images
dials.image_viewer can be opened using the files produced from the various processing steps.
A matching pair of .refl and .expt files are required.
If the auto processing has completed, then the files corresponding to the final stage reached (scaling) are written to the DataFiles folder (e.g., dls/i19-1/data/2021/cm28127-3/processed/sugar/sugar_4/xia2-dials/DataFiles
visit_xNAMErun_scaled.refl
visit_xNAMErun_scaled.expt
From DataFiles, type:
dials.image_viewer AUTOMATIC_DEFAULT_scaled.refl AUTOMATIC_DEFAULT_scaled.expt
(shortcut type: dials.ima TAB)
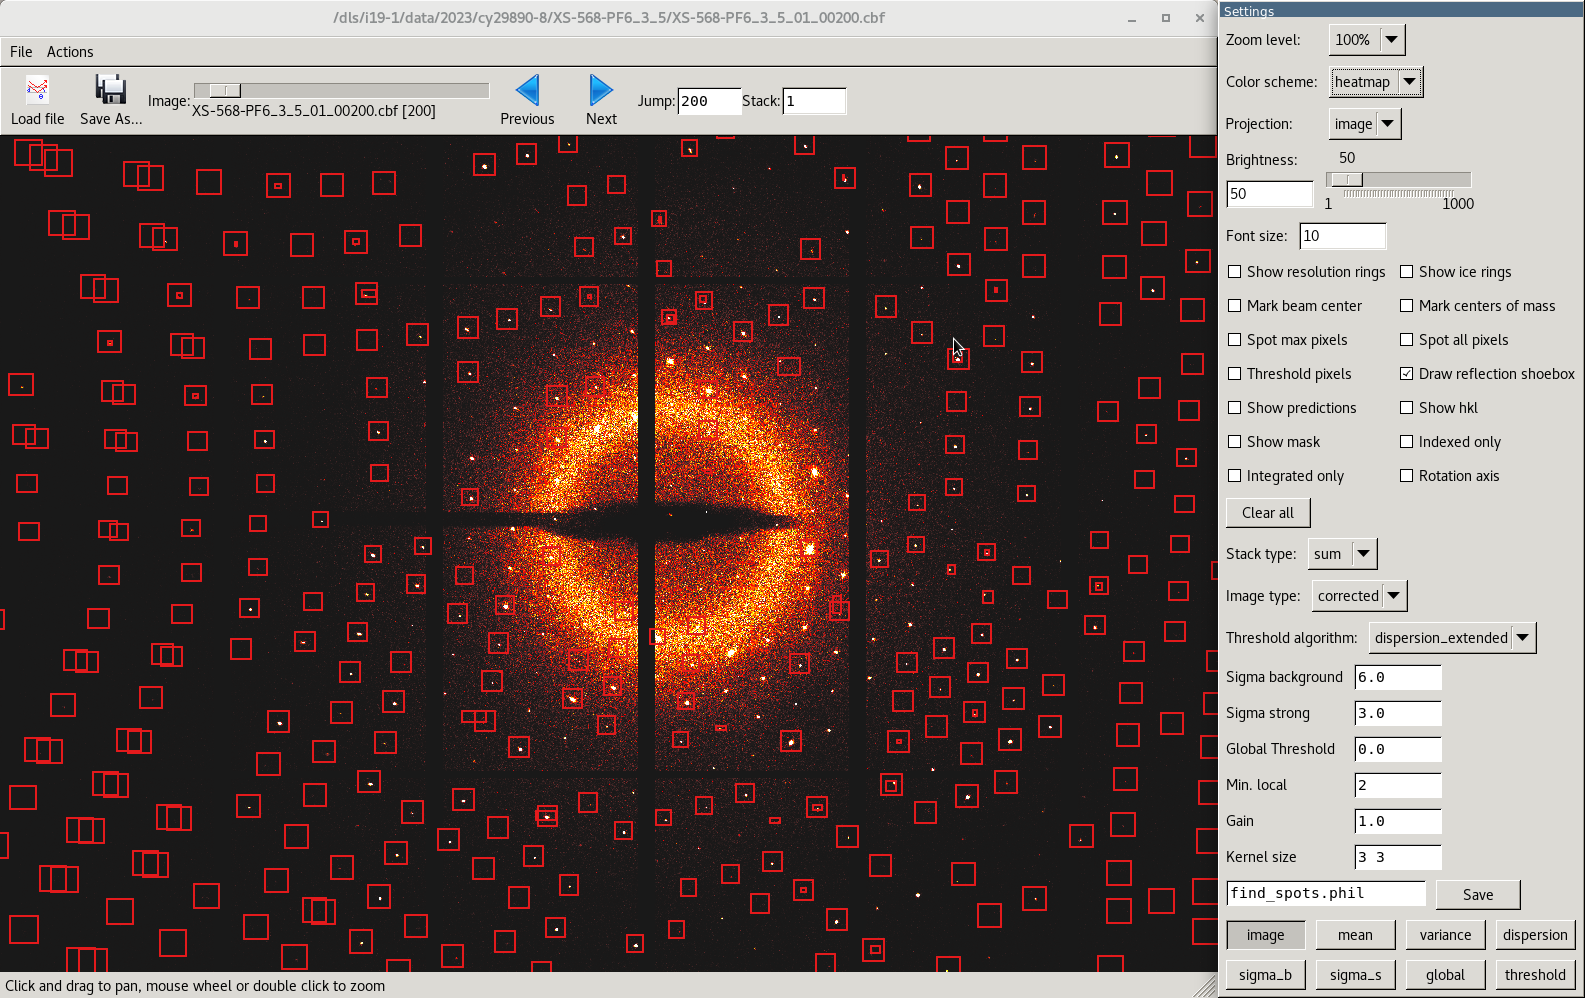
By opening the images this way, knowledge of the indexing is read in so having the options checked will show how well the indexing has been done, for example.
Changing the display options may prove useful to help determine a better threshold value for spot finding for indexing (the setting for sigma_strong) See Dials image viewer for more information
The image viewer can also be opened using pairs of files stored on zocalo that are produced during the refinement, for example indexing (as above for the reciprocal lattice).
Check the Logs and Plots
All useful plots and log files are available from ISPyB but it may be useful to check the xia2.txt file to check how the processing looked.
1. Spot Finding
Check the spot finding histograms for each sweep of data included – ideally the histograms should be even heights across the sweeps without warnings of blank sections.
Uneven histograms can be an indication of the sample moving in and out of the beam or just be a consequence of an asymmetric crystal shape.
A downward slope of intensities can be an indication of crystal damage, possibly due to the X-rays – damage analysis can be run to give an indication of where best to cut the data.
Blank images can be a sign of the crystal moving completely out of the beam, but they may also indicate that something strongly scattering has moved into the beam, for example if the sample pin is not firmly fixed in the cryocap, these densely populated images disrupt the algorithm meaning the “normal” images are flagged as blank.
Check the images manually (in your image viewer of choice) to see which case is present. Processing can then be rerun ignoring either the blank or contaminated images as appropriate, to see if this makes any improvement to the end result.
2. Integrating
Ideally, the block would consist of a lot of oooooo. If there are a lot of “bad” symbols, check the indexing solution matches the data using the reciprocal lattice viewer and check the reflection shapes in the images.
3. Scaling
Look at the estimated resolution limit - if the estimated cutoff is very different to the resolution of the data collected, reprocessing with a defined resolution limit will improve the integration statistics. Also check the merging-statisics.txt and/or plots to determine what the limit should be set to.
4. Statistics
Check the values for each column. If the overall completeness is low when a full sphere of data has been collected, the indexing is probably incorrect. A high Rmerge can be improved by including a resolution cutoff and/or removing any images where radiation damage is significant.

Diamond Light Source is the UK's national synchrotron science facility, located at the Harwell Science and Innovation Campus in Oxfordshire.
Diamond Light Source Ltd
Diamond House
Harwell Science & Innovation Campus
Didcot
Oxfordshire
OX11 0DE
Copyright © Diamond Light Source. Diamond Light Source® and the Diamond logo are registered trademarks of Diamond Light Source Ltd
Registered in England and Wales at Diamond House, Harwell Science and Innovation Campus, Didcot, Oxfordshire, OX11 0DE, United Kingdom. Company number: 4375679. VAT number: 287 461 957. Economic Operators Registration and Identification (EORI) number: GB287461957003.