Data Quality Plots
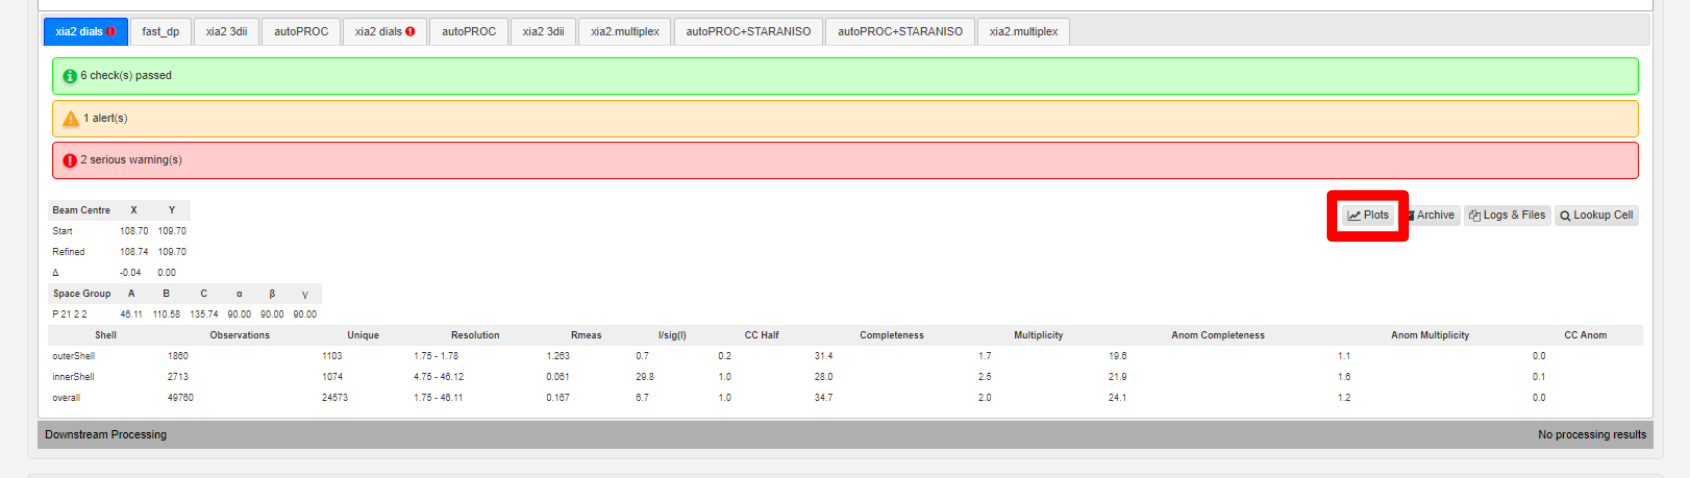
Each autoprocessing routine can be compared using plots of resolution versus parameters such as CC1/2, number of observations etc. Plots of these parameters can be reached using the Plots button in each autoprocessing overview:
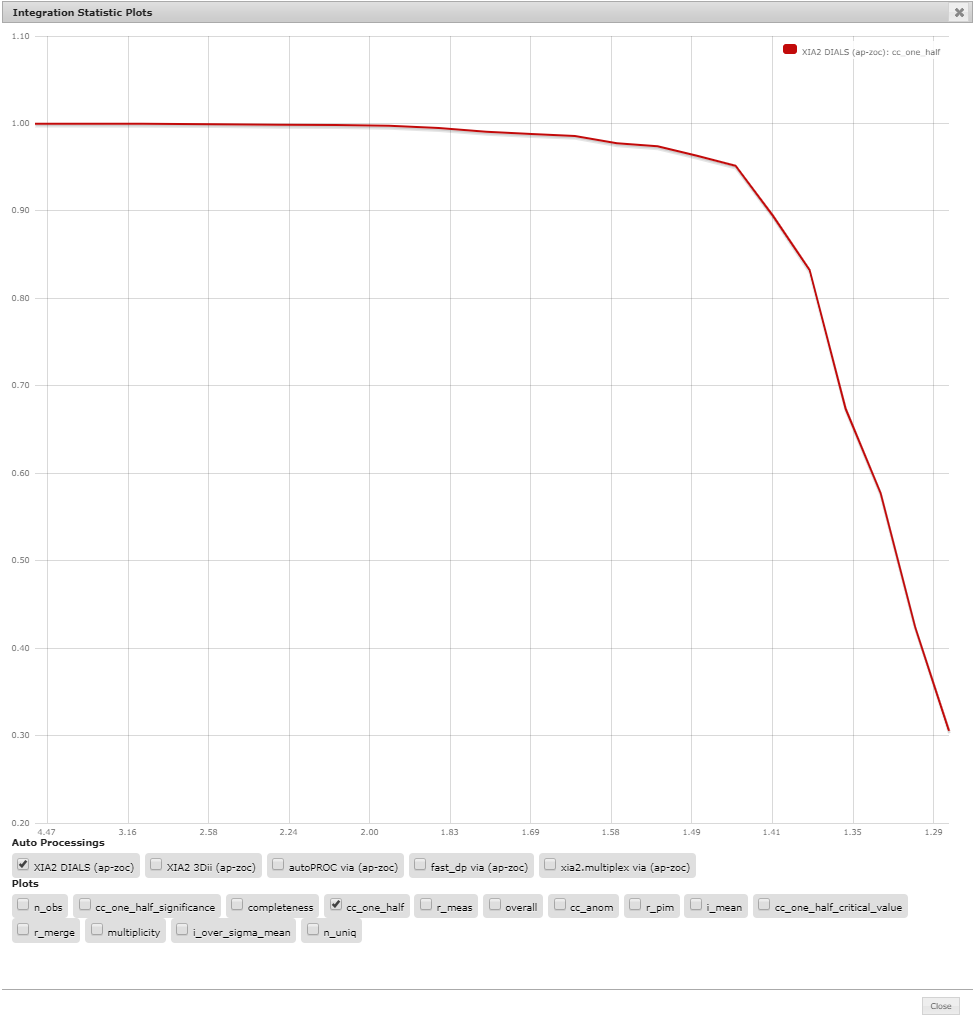
This bring up a plotting interface. All parameters are plotted with resolution on the x-axis (currently this is not labelled).
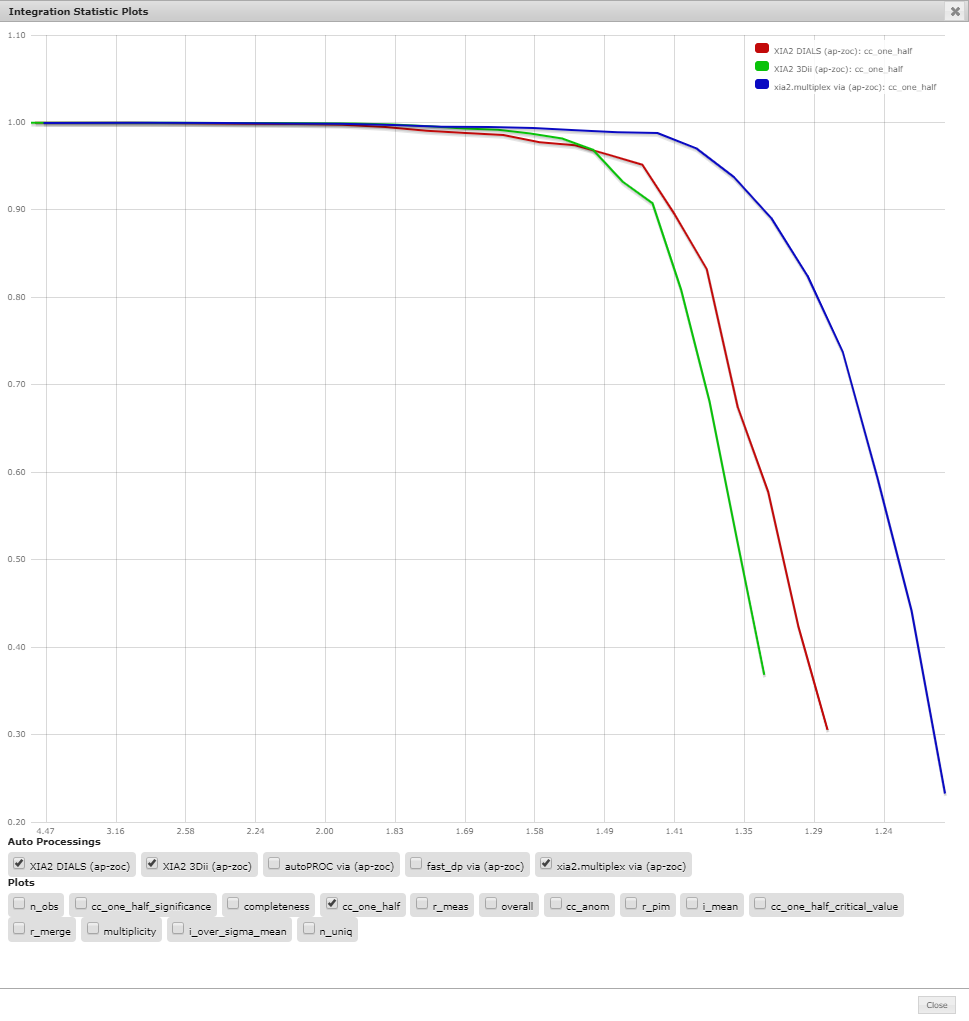
Multiple programs can be compared, including autoprocessing runs on multiple crystals or multiple sweeps:
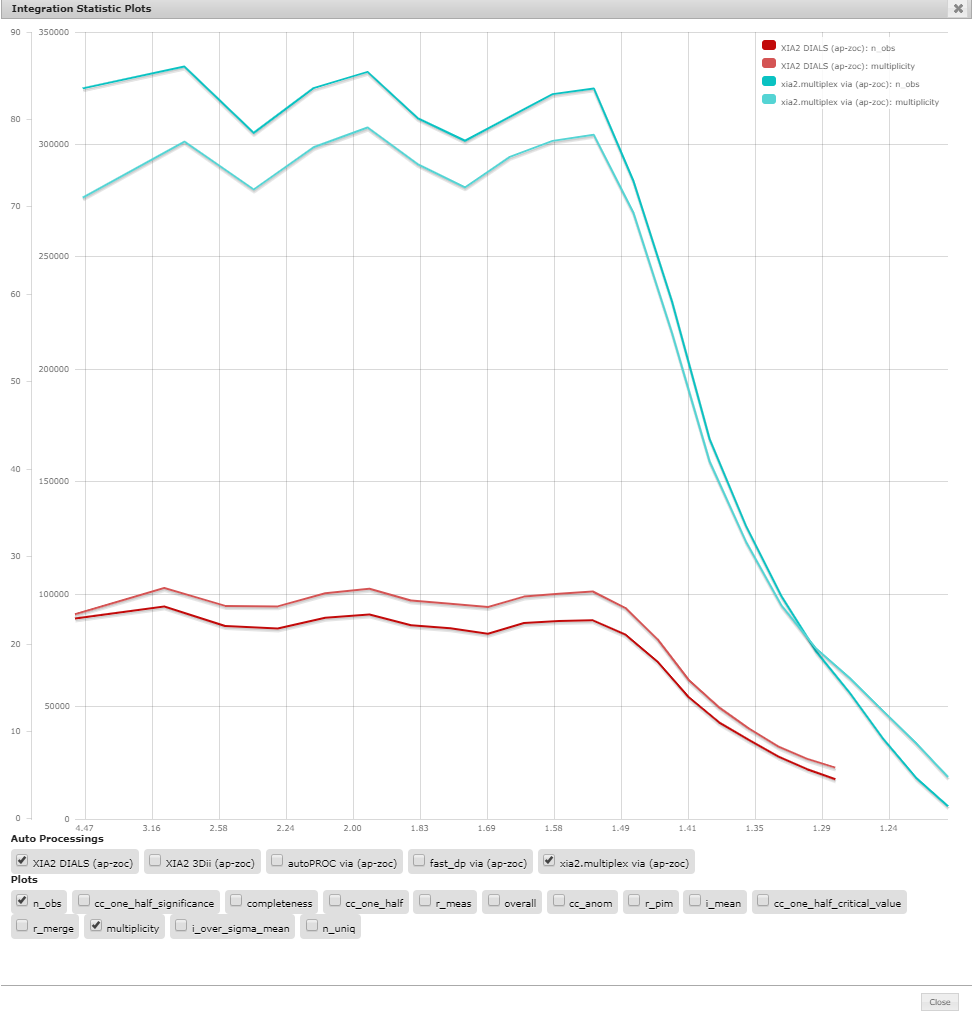
Or by introducing two parameters with different scales, multiple y scales are shown: