Instruments by Science Group
I14 Contact
I14 Control room:
Tel: +44 (0) 1235 778570
Principal Beamline Scientist:
Majid Kazemian
Email: [email protected]
Tel: +44 (0) 1235 778222
Science Group Leader
Julia Parker
Email: [email protected]
Tel: +44 (0)1235 778924
I14 Hard X-ray Nanoprobe
Status: Operational
Beamsize: 50nm x 50nm
Energy: 5 - 20 keV
Energy: 5 - 20 keV
Inspecting the data: IspyB
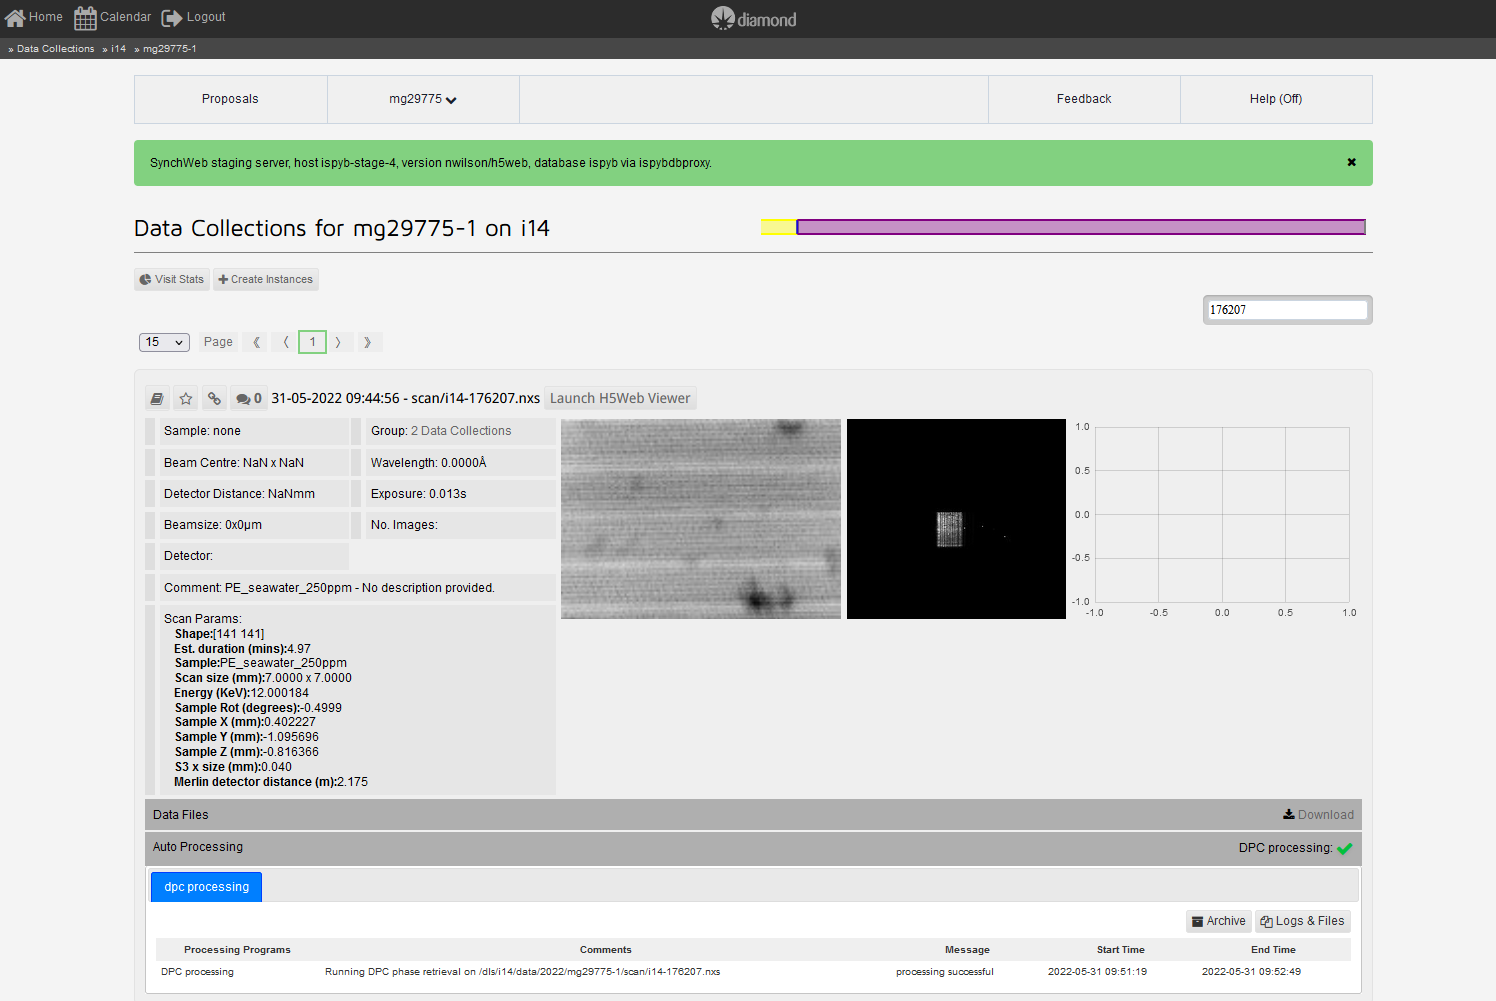
- Example of XRF data associated to an i14 scan - IspyB
All I14 data can be found, pre-inspected and also downloaded using the IspyB platform.
Once logged using your credentials, you should have access to all the older data linked to your FedID. Navigating through the 'Proposals' section, and selecting the corresponding session (mgXXXXX-Y) in the 'visit list' (at the top, as shown in the image above), the searching bar located at the top-right of the website can be used for searching one specific scan number. Selecting the data collections indicated in the "Group" option (first row), all the associated data will be easily accessed in a separate window.
An example of the XRF data of an i14 scan is presented in the image above. Expanding the "Auto Processing" option, the associated DPC processed run is displayed in there. By selecting the "Logs & Files" button, the 'i14-xxxxxx-xrf_windows-xsp3_addetector*.nxs' files can be downloaded.
How to handle XRF data from I14
DAWN is the recommended visualisation software for handling XRF data, but you may want to further “normalise and/or fit” your results by using PyMca. A windows/mac version of these software can be downloaded following the above links, but these resources can be directly accessed in Diamond's Linux session (following the NoMachine remote connection steps), by typing in a terminal:
| module load dawn dawn & |
(this two-command line will launch dawn)
| module load pymca pymca |
(to launch pymca)
Summary of files produced and how to use them:
• Raw ‘i14-******.nxs' files: Stored in the “scan” directory. These files can be inspected using the DataVis perspective from DAWN. They contain the ‘summed and raw data’ from the detectors implicated (if XRF/Imaging was selected when doing the XRF mapping at GDA, both the fluorescence xsp3 and the Merlin detector will record signals). Comprehensive information about the experimental parameters and scannables (e.g. Energy, time, scan range, etc.) can be found in there, by right-click on the scan name, selecting “view tree” and navigating through the drop-down menus. For additional guidance on how to use DAWN and/or our in-house python-scripted jupyter notebooks, please have a look to this video.
• Processed ‘i14-******-xrf_windows-xsp3_addetector*.nxs' files: Stored in the “processed” directory, can be viewed using the Mapping perspective from DAWN. Basically they contain all the elements signal which has been summed. Sometimes the GDA automatic processing may fail when the .nxs raw file does not generate an equivalent “**xrf-windows-xsp3**” file in the “processed” directory. If that is the case, or if you want to add an additional element for visualisation, follow the steps indicated in Confluence (login with your FedID) or alternatively download this guide.
XANES data analysis
The XANES hyperspectral maps at I14 generally consists of ~150 XRF individual images acquired along the absorption edge of the targeting element. In order to evaluate the spectroscopic results, these scans have to be combined into a single .hdf5 file. This can be done through an automated jupyter notebook, by typing in a terminal:
|
module load python/epsic3.7 |
Opening the “XANES_dataworkflow.ipynb” notebook later, and updating the correct directory in “inpath – nexus_format” and in the “oupath”, with your session ID (mgxxxxx-y).
The “elements_to_load” should contain the electronic transition studied for both "element_to_align" and the "edge_element" of the targeted xanes in chemical nomenclature (i.e. Fe-Ka)). If there is no other element to use for alignments, just indicate the same transition for both values.
Finally, update as the “first” and “last” scan numbers just below. Once this is done, selecting ‘Cell’ in the top bar and subsequently ‘Run all’ should generate the ‘mantis_*****_*****.hdf5’ file in your “processing” directory after about 10-15 minutes. Please, check the available tutorial video explaining how to run the xanes_dataworkflow notebook.
Data interpretation
For .hdf5 data evaluation, please read the available guide for I14 users where it is indicated how to open (and handle) these files by DAWN, MANTiS and Athena; and the spectroscopic information you could extract from these.
Disclaimer: This document does not aim to be a comprehensive guide describing all the capabilities of the indicated software, but rather a descriptive manuscript on how to use them for I14 data visualisation. Further information on how to get the most of your data can be found in the external links within the document above.
For example, it is strongly advisable to read carefully the developers official guide for MANTiS, where all the steps for a comprehensive spectroscopic analysis are described (and the references for publication therein).
How to acknowledge beamtime data -- Post-session report
All publications resulting from the use of the Diamond facilities should acknowledge the facility and proposal. As example:
"We acknowledge Diamond Light Source for time on [beamline(s) number/offline lab/other facility] under proposal [proposal number/ID]"
Facility staff continue to push the facilities and capabilities forward with new techniques, new software and new hardware. Please ensure you are citing their work correctly where it has enabled your experiment or analysis. Details of key citations and how to determine which citations to include can be found on that facility's webpage.
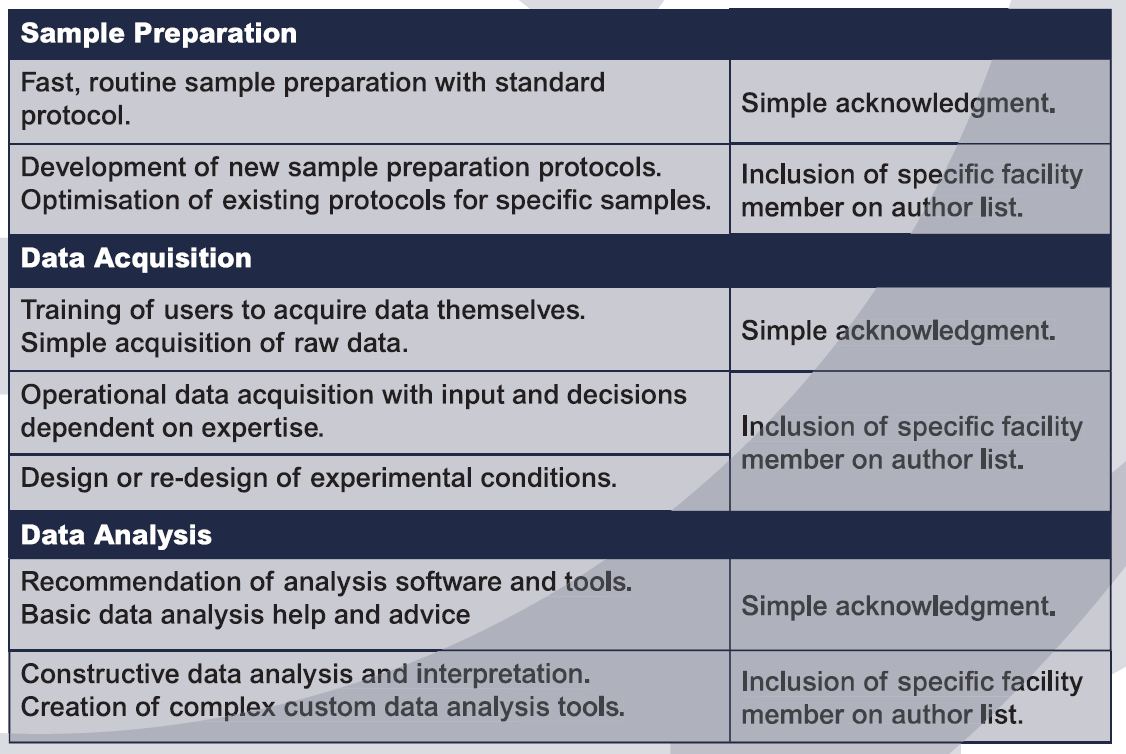
Assistance above the technical or routine level, with any facility staff providing scientific input and expertise in experimental setup, acquisition or analysis, should be recognised through co-authorship on the resulting publications. Please discuss acknowledgements with facility staff prior to manuscript submission.
Furthermore, bear in mind that all proposals require a report once the session is completed (within 6 months). This report should include any changes in methodology that were required and highlight key results as well as indicate the status of the project(s) in light of these results.
You would be prompted to complete this process through UAS, where an appropriate template can be downloaded. These reports are made available to the Peer Review Panel when they are considering further proposals from the same Principal Investigator and failure to submit a report can be considered detrimental for future instrument access.

Diamond Light Source is the UK's national synchrotron science facility, located at the Harwell Science and Innovation Campus in Oxfordshire.
Diamond Light Source Ltd
Diamond House
Harwell Science & Innovation Campus
Didcot
Oxfordshire
OX11 0DE
Copyright © Diamond Light Source. Diamond Light Source® and the Diamond logo are registered trademarks of Diamond Light Source Ltd
Registered in England and Wales at Diamond House, Harwell Science and Innovation Campus, Didcot, Oxfordshire, OX11 0DE, United Kingdom. Company number: 4375679. VAT number: 287 461 957. Economic Operators Registration and Identification (EORI) number: GB287461957003.