Allocation Period (AP) details
The current Allocation Period is AP39 which will run until 30th September 2026.
The proposal call for AP41 (1st April 2027- 31st December 2027) is currently open. The deadline for submission is at 17:00hrs UTC:GMT on 30th September 2026.
We accept requests for rapid access at any point in time. See here for details.
Run details
Details of Run 2 of 2026 and Run 3 in 2026:
| Run 2 2026 | Start Date | End Date |
| MX Sample Shipping | From 5th April | To arrive on/by 15th May |
| MX User Beamtime | From 15th April | Ends at 9am on 22th May |
| Run 3 2026 | Start Date | End Date |
| MX Sample Shipping | From 7th June | To arrive on/by 7th August |
| MX User Beamtime | From 17th June | Ends at 9am on 14th August |
Shutdown Details
- There are planned upgrades from RHEL7 to RHEL8 for the majority of the MX beamline servers during this shutdown period.
User outreach
Training
- Our next Onsite MX User Training session is scheduled for 25th & 26th June 2026. This session will be designed for experienced macromolecular crystallography and to advanced user at Diamond. Applications for this are now open and closes at 12:00 (BST) on Monday 18 May 2026. Please follow the link for more details and registration.
ISPyB / SynchWeb Updates
Grouped Data Collections in ISPyB / Synchweb
When more than one sweep of data is collected on the same sample at the same time, the data collections are grouped together in our ISPyB database. We have now coloured these blue in Synchweb to highlight thay they are a group.
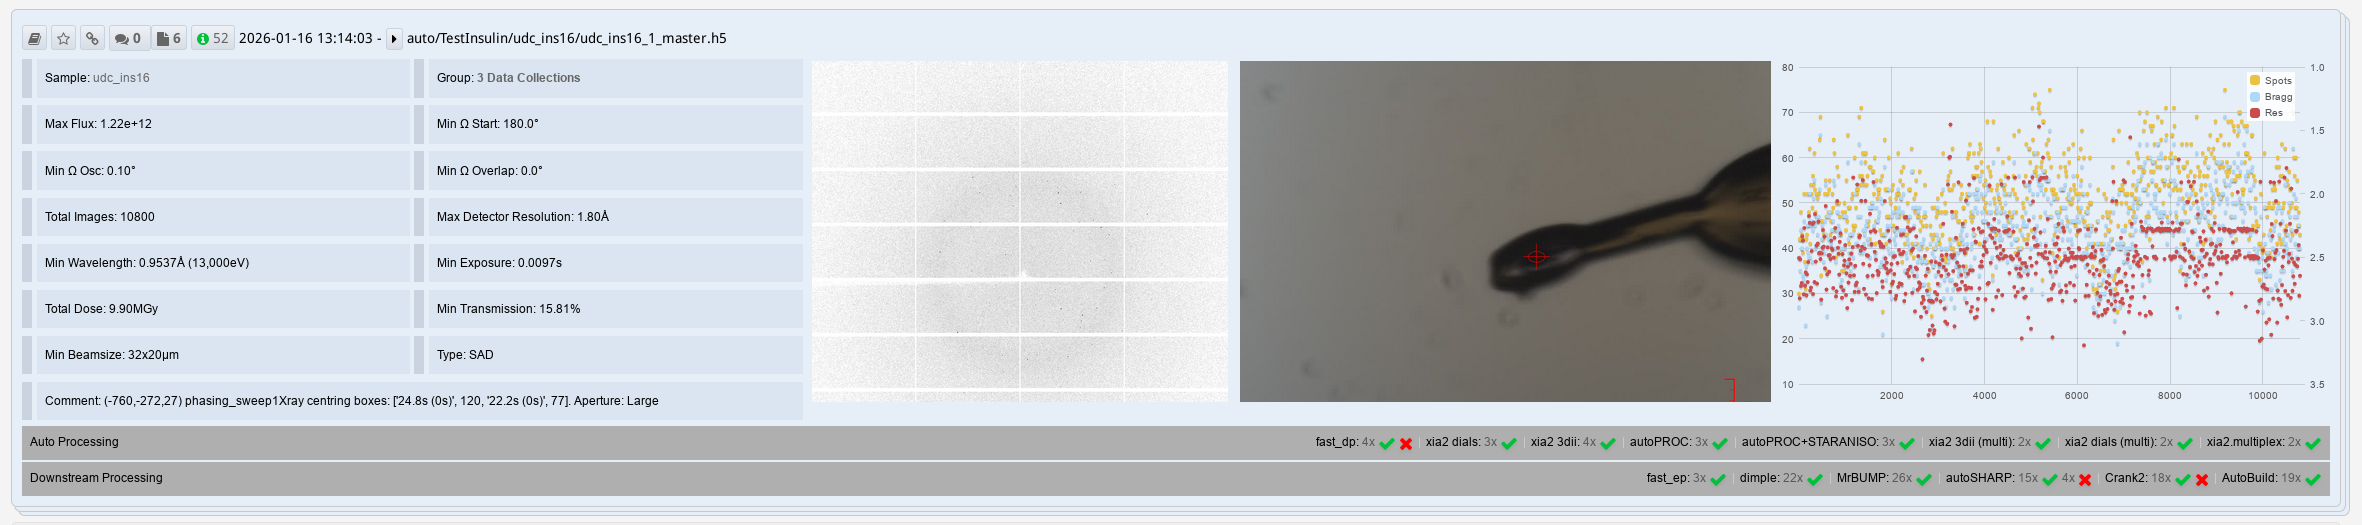
The graph of spots shown for a group includes all images in the group, and the data processing shown below a group is for all data collections in the group, as well as any pipelines that run on multiple data collections, eg xia2.multiplex.
If you want to re-run any data processing pipelines, click on the "x Data Collections" link to show the data collections individually, and run the processing from there.
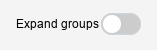
If you would prefer not to see data collections grouped together, you can toggle the "Expand groups" switch in the top right of the screen. This preference is stored as a cookie and so will remain set on your computer.
Processing snippets
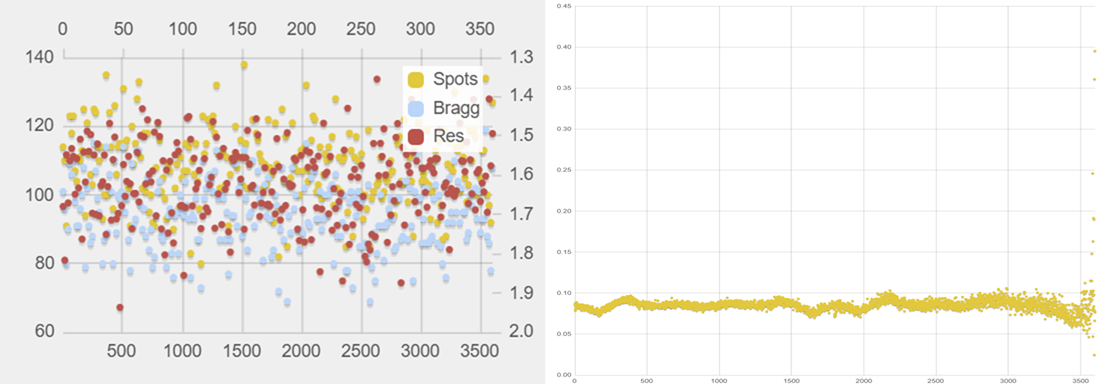
- Data set which is collected with a minimum radiation damage
Radiation‑Damage Plots
Radiation damage is an important factor in macromolecular crystallography, as X‑ray exposure can progressively degrade a crystal during data collection. To help users monitor this effect, ISPyB/SynchWeb provides Radiation Damage Plots, generated automatically as part of the Fast DP autoprocessing pipeline. These plots allow users to visually assess how diffraction quality changes across the duration of a dataset. Diamond’s documentation explains that the plots are produced alongside Fast DP results and accessed by selecting the dataset → Fast DP → Radiation Damage in ISPyB’s autoprocessing interface.
A typical radiation‑damage plot displays Rd (radiation‑damage indicator) versus frame number, following the method of Diederichs (Acta Cryst. 2006, D62, 96–101). A flat slope indicates little or no radiation damage, whereas an upward slope (Rd plot) implies progressive damage as the dataset advances. Such damage can also be observed as an downward slop in the per image analysis. Here you can find a quick explanation of the plot.
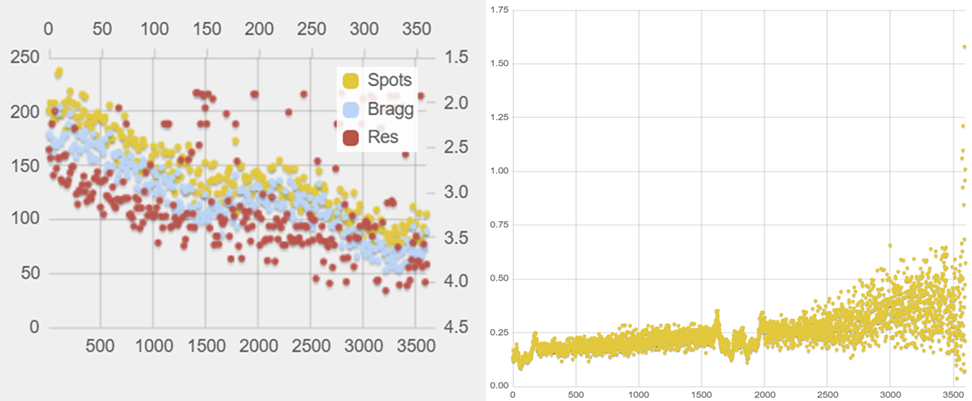
- Dataset showing sings of getting effected with radiation damage.
ISPyB also offers complementary tools, including per‑image analysis, spot‑profile inspection, and ice‑ring detection, integrated into the real‑time SynchWeb interface for experiment monitoring. These tools help users identify intensity decay or other issues arising from radiation damage during data collection. If damage is detected, ISPyB’s reprocessing (processing snippets from issue3) allows users to exclude compromised frames by selecting start/end image numbers or dragging across the spot‑analysis plot, enabling cleaner datasets for downstream processing.
Selected Publications
In an Angewandte Chemie paper, researchers from the University of Sheffield and Diamond Light Source demonstrate how multi‑crystal X‑ray diffraction (MCXRD) can bridge crystallographic gaps for challenging chemical and materials systems, here exemplified by metal–organic frameworks. Diffraction data were combined from micro‑ and nanocrystals ranging from 10 μm down to 700 nm, collected across Diamond beamlines I04, I24 and VMXm. This approach demonstrates how matching crystal size to beamline and beam properties enables robust structure determination. This work highlights how Diamond’s diverse macromolecular crystallography instrumentation can overcome barriers that have traditionally limited structural studies in chemistry and materials science.
Read more from the article
Multi-Crystal X-Ray Diffraction (MCXRD) Bridges the Crystallographic Characterisation Gap in Chemistry and Materials Science: Application to MOFs. J.P. Smith, et al. Angew. Chem. Int. Ed.2026, 65, e23233
Science in focus
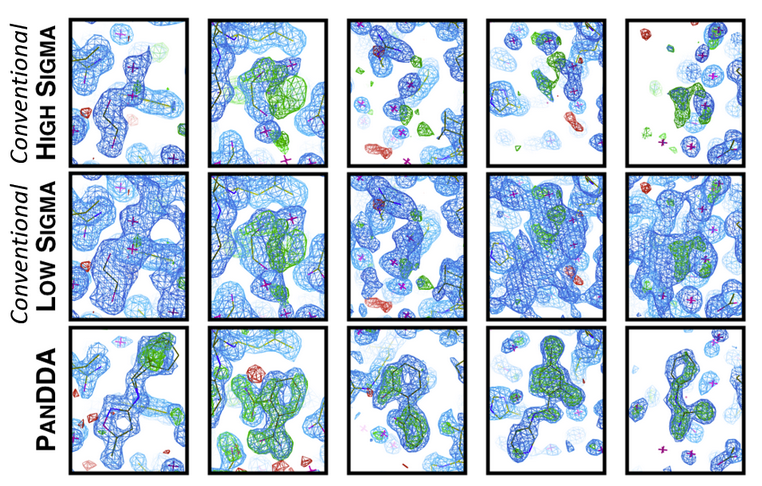
The Pan-Dataset Density Analysis (PanDDA) algorithm was developed to address low occupancy ligand binding in fragment screens, which makes binding sites difficult to identify and model in conventional crystallographic maps. Learn more about the philosophy of PanDDA algorithm from Conor's article for this Newletter ..
My Days at Diamond
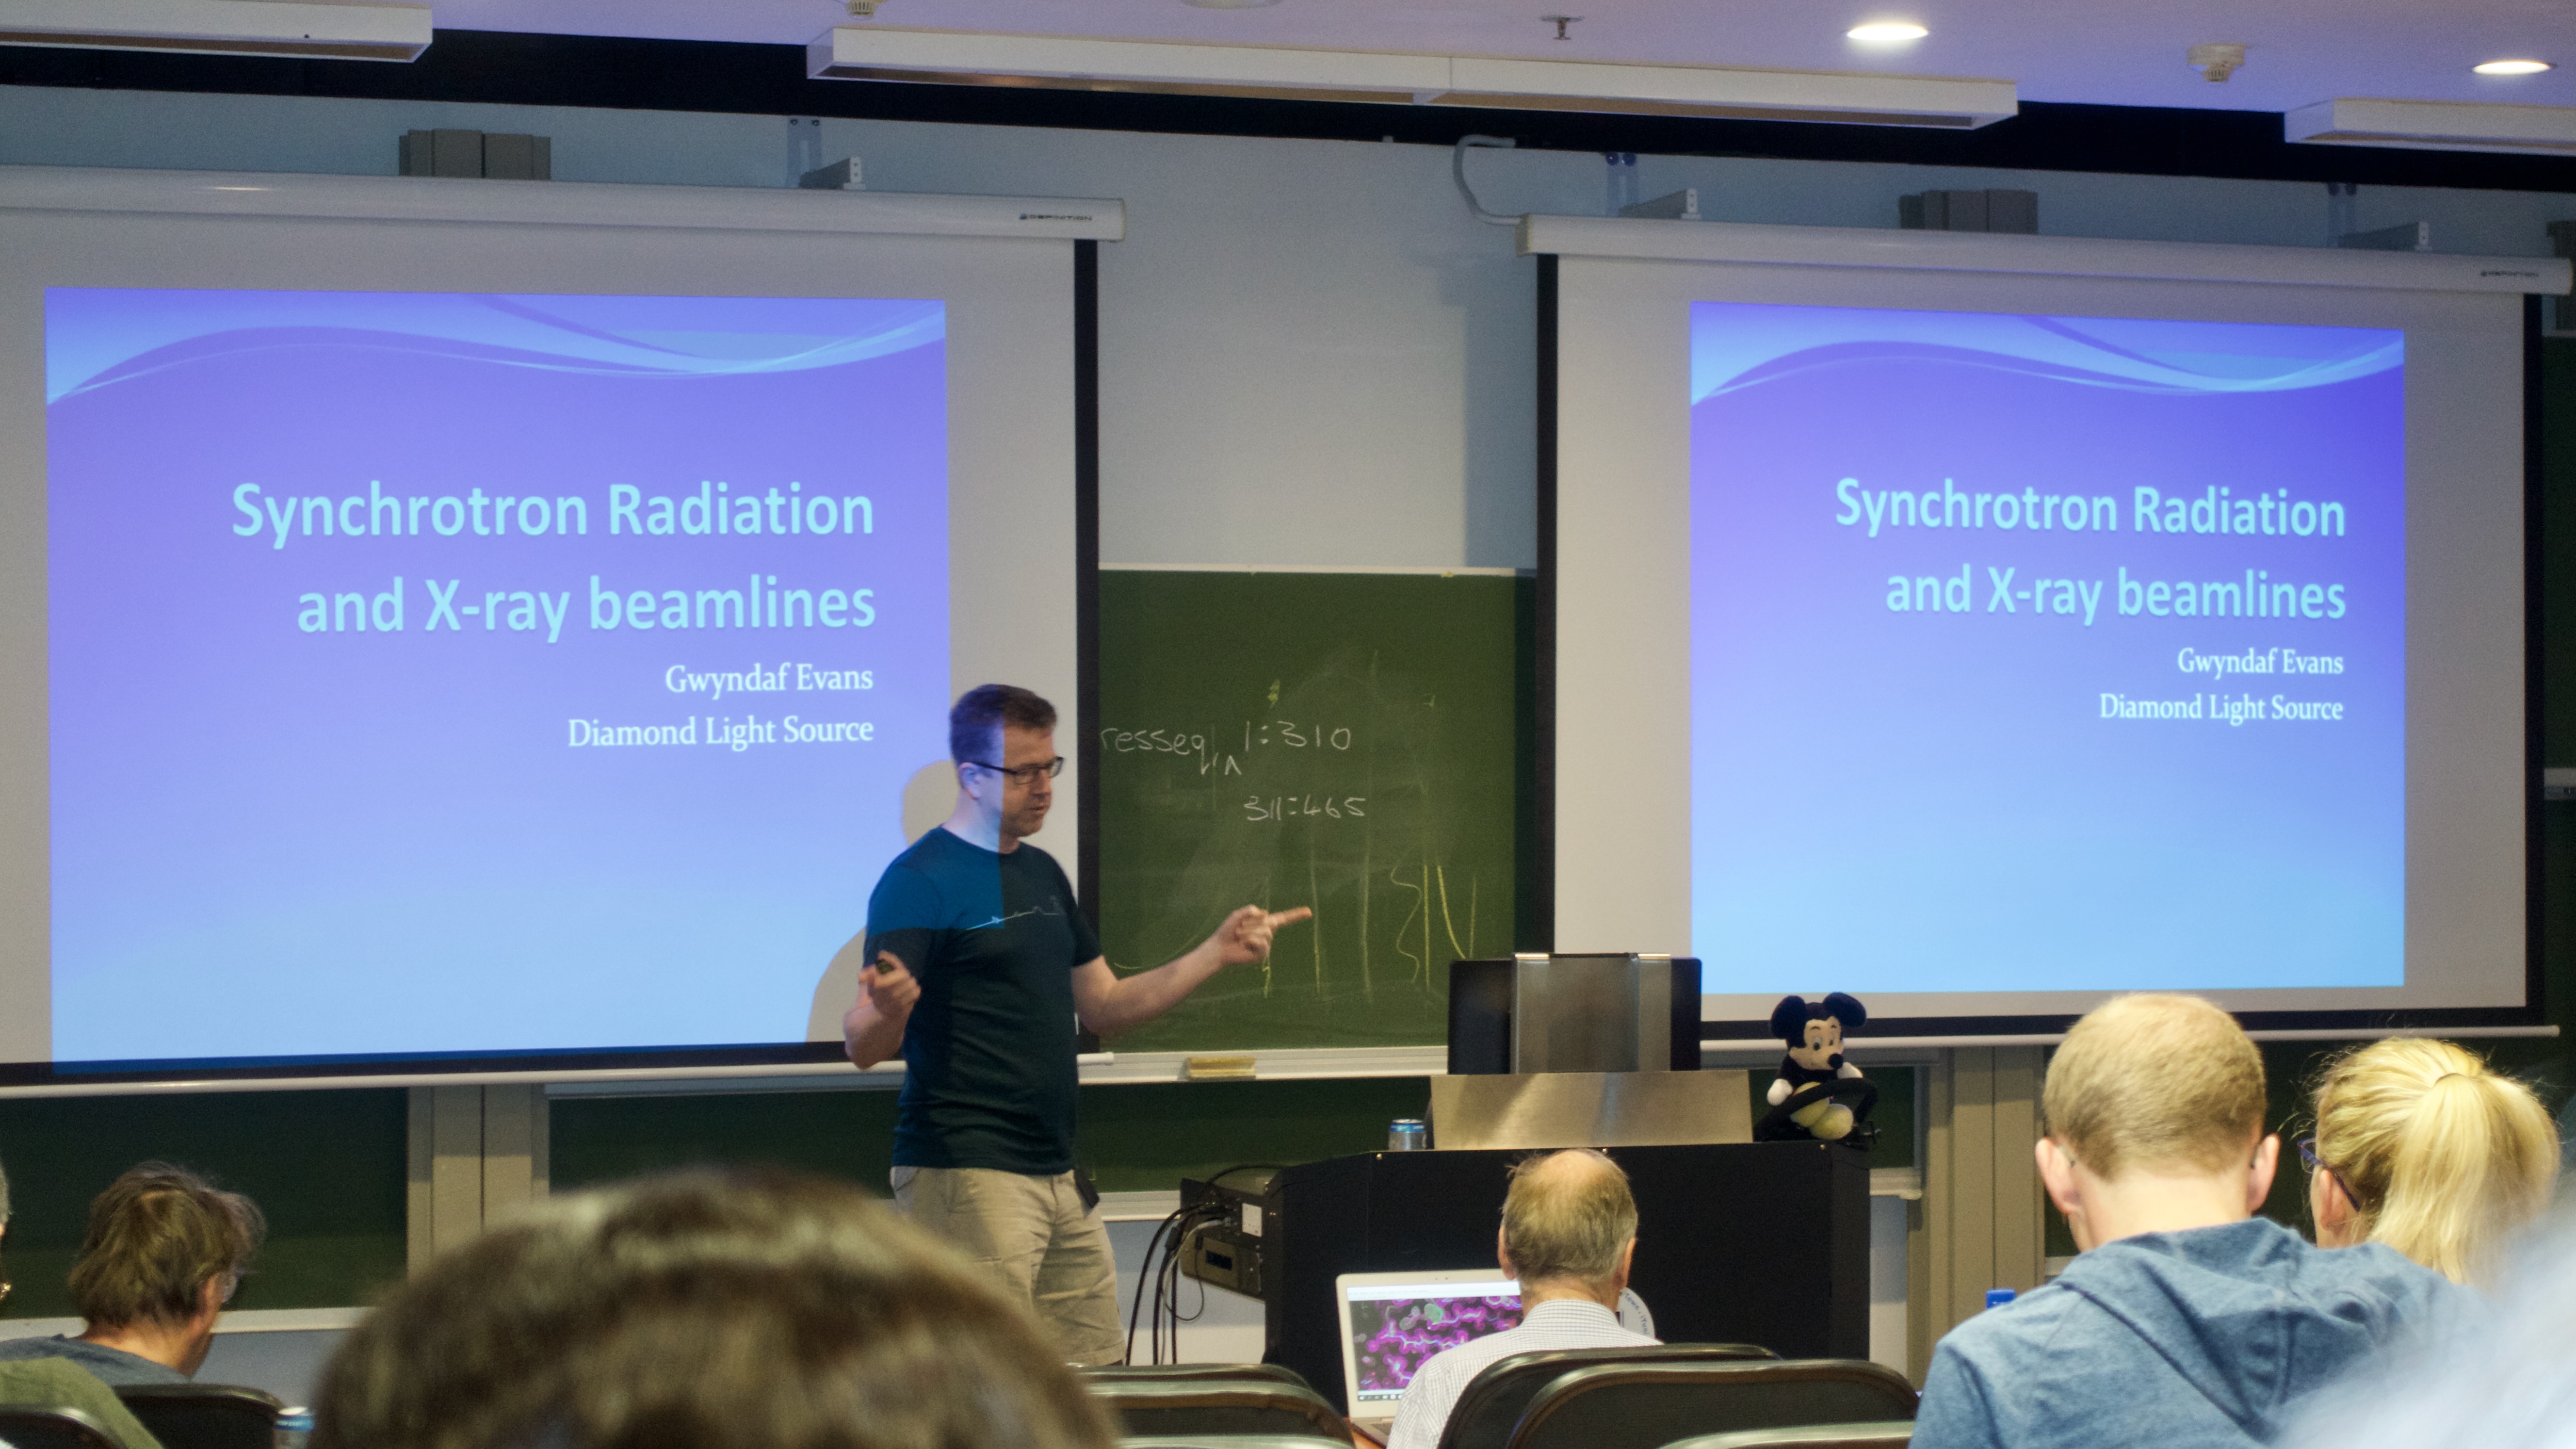
After two decades at Diamond, Gwyndaf Evans retired earlier this year. During this period, he served as PBS for I24 and VMXm, and later as Deputy Director for Life Sciences at Diamond and at the Rosalind Franklin Institute (RFI). In this article, Gwyndaf reflects on his years at Diamond and his experiences beyond.
Users who wish to contribute to an upcoming issue by sharing their scientific story or describing how Diamond has supported their research are invited to contact us via E-mail with your suggestions.

Diamond Light Source is the UK's national synchrotron science facility, located at the Harwell Science and Innovation Campus in Oxfordshire.
Diamond Light Source Ltd
Diamond House
Harwell Science & Innovation Campus
Didcot
Oxfordshire
OX11 0DE
Copyright © Diamond Light Source. Diamond Light Source® and the Diamond logo are registered trademarks of Diamond Light Source Ltd
Registered in England and Wales at Diamond House, Harwell Science and Innovation Campus, Didcot, Oxfordshire, OX11 0DE, United Kingdom. Company number: 4375679. VAT number: 287 461 957. Economic Operators Registration and Identification (EORI) number: GB287461957003.