Tomography-based absorption corrections for long-wavelength MX
Why long wavelength?
Long wavelength X-ray diffraction experiments enable the measurement of anomalous signal from biologically relevant ions (Ca2+, K+, Cl-, Mg2+ and Na+) and elements, such as S and P, natively found in macromolecules. Beamline I23 [1] at Diamond Light Source, UK, is a unique instrument operating in a wavelength range between 1.1 and 5.9 Å, designed to target the absorption edges of many such light elements. This can be used to confirm their binding sites within macromolecules [2] or solve structures by native experimental phasing using single-wavelength anomalous diffraction (SAD) [3]. Correct assignment of ions in macromolecular structures is of increasing importance, given the rapid development of structure prediction tools which train on published structures, many of which contain errors. To make these experiments possible, while mitigating the increased absorption of long wavelength X-rays by air, the sample environment on beamline I23 is a highly specialised in-vacuum setup, which incorporates a 12M Pilatus curved detector and multi-axis goniometry. To address the significant absorption of X-rays by the sample itself, a volumetric characterisation of the sample is generated, to enable calculations of X-ray paths through all the materials of the sample (crystal, solvent and mounting loop) and their absorption coefficients. For this purpose, beamline I23 is equipped with a tomography setup consisting of a PCO 1600 tomography camera, mounted outside vacuum, and scintillator and associated optical elements located in vacuum [1,4] (Figure 1).
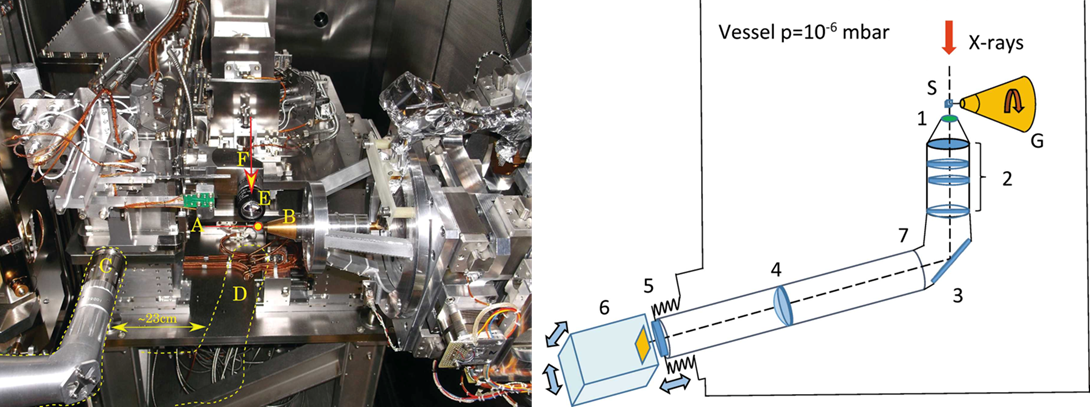
- Figure 1. Left: View inside the I23 vacuum endstation showing positions of components of the sample environment. A: sample position; B: goniometer; C: tomography camera, retracted position; D: tomography camera, in-beam position; E: on-axis viewing system; F: X-ray beam direction. Right: A schematic drawing of the tomography system. 1 – scintillation screen, 2 – objective, 3 – mirror, 4 – relay lens, 5 – vacuum window, 6 – tomography camera, 7 – L-shaped tube. The system is residing inside of a vacuum vessel with pressure bellow 1.0 × 10⁻⁶ mbar. X-rays are impinging upon a protein sample (S) mounted on the goniometer (G).
Sample absorption at long wavelengths
The intensities of diffraction spots measured in X-ray crystallography experiments are proportional to the square of structure factor amplitudes, with additional correction factors applied for a range of physical effects such as Lorentz, polarization, decay, sample illumination and absorption. As sample absorption is proportional to the cube of the wavelength [5], increasing the wavelength of the incident X-rays from λ = 1 Å to λ = 4 Å, leads to a 64-fold increase in absorption. To compensate for this and enable accurate calculations of structure factor amplitudes, at longer wavelengths it becomes necessary to apply absorption corrections factors. These depend on the chemical composition and densities of materials in the sample, as well as the distances of the incident and diffracted X-ray beams through these materials.
Empirical absorption correction methods are incorporated in standard scaling algorithms used in data reduction protocols and rely on minimizing differences between structure factors amplitudes of symmetry-related reflections [6,7]. Analytical absorption corrections rely on accurate volumetric characterisation of the sample to enable calculation of X-ray paths through all the materials in the sample. In protein crystallography, these materials are, invariably, the protein crystal, the solvent around the crystal and the loop used for mounting, with varying chemical compositions and densities, and thus varying absorption coefficients.
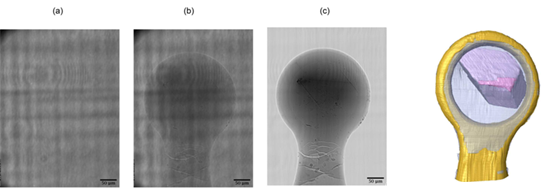
- Figure 2. Left: Tomography projection images for background (a), sample (b) and flat-field-corrected images (c). Right: Volume rendering of segmentations a protein crystal sample. Transparent blue: mother liquor; gold: loop; pink: crystal; green: protein/detergent aggregate.
Tomography experiment
When dealing with samples of irregular shape, where one dimension is much larger or shorter than others (for instance rod-shaped or plate-like crystals), X-ray paths through the sample will lead to different levels of attenuation affecting symmetry-related reflections. To calculate analytical absorption correction factors, an accurate 3D model of the sample is needed, which is obtained by complementing the diffraction experiment with X-ray microtomography. At the end of the diffraction experiment, the tomography camera is moved in the beam path, behind the sample, and a series of images is collected while the sample is rotated through 180 degrees (Figure 2). The reconstruction of the tomography dataset is followed by segmentation, whereby each voxel (3D pixel) in the data is assigned to one of the materials in the sample composition (crystal, solvent or loop). The flat-field corrected tomography images and the corresponding segmented data are used to determine the absorption coefficients required in the calculation of analytical absorption correction factors.
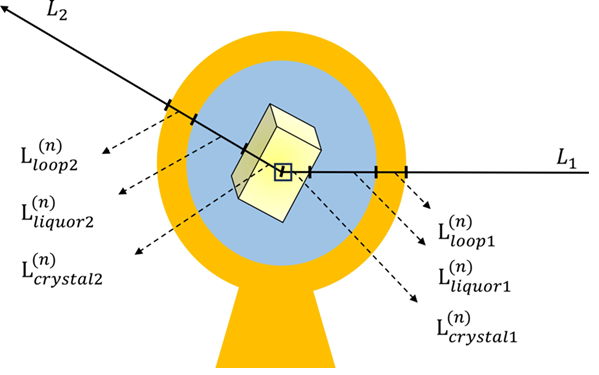
- Figure 3. A sketch illustrating the ray-tracing method used to calculate an absorption correction factor for a crystal voxel n. L(n)m1 and L(n)m2 represent the path lengths of the incident and diffracted X-ray beams through the material m (loop, liquor and crystal).
Absorption correction software
The analytical absorption factors are calculated using a software called AnACor [8, 9], developed in collaboration with Oxford University and is integrated with DIALS [10]. The annotated 3D model of the sample from tomography, along with the orientation matrix of the crystal provided by integration software DIALS, are used by a ray-tracing algorithm within AnACor, which calculates the distances of the incident and diffracted X-rays from every volume element in the crystal contributing to each reflection in the dataset (Figure 3). The absorption correction factors are then calculated by considering the absorption coefficients of each material in the sample. In the scaling step within DIALS, these analytical absorption correction factors are combined with the other corrections necessary for scaling.
![Figure 4. Anomalous difference Fourier maps contoured at sigma level 3.6, showing the location of the Na+ ion. Magenta, the map calculated from the data with analytical absorption corrections applied (ACSH). Blue, the map calculated from the data processed with standard empirical absorption corrections (SH). The anomalous peak heights are 7.7 sigma for the ACSH-corrected data and 5.6 sigma for the SH-corrected data. The anomalous maps were generated with Dimple [11].](/dam/jcr:397980e0-0051-4b8a-9b2c-15fa680a07a9/Science_in_focus6.png)
- Figure 4. Anomalous difference Fourier maps contoured at sigma level 3.6, showing the location of the Na+ ion. Magenta, the map calculated from the data with analytical absorption corrections applied (ACSH). Blue, the map calculated from the data processed with standard empirical absorption corrections (SH). The anomalous peak heights are 7.7 sigma for the ACSH-corrected data and 5.6 sigma for the SH-corrected data. The anomalous maps were generated with Dimple [11].
Benefits of absorption corrections
Diffraction data collected at wavelengths longer than 3.5 Å, shows a marked improvement in data quality indicators, as a result of applying tomography-based absorption corrections. This is pronounced especially at very long wavelengths or for low symmetry crystals, when standard empirical corrections are not very efficient. Table 1 presents merging statistics for data collected on a lysozyme crystal at λ = 5.16 Å, chosen to optimize the anomalous signal from a Na+ ion bound to the protein. By combining the standard spherical harmonics (SH) absorption correlation method with analytical absorption corrections (ACSH), we see an increase in I/sig(I) from 30.9 for the SH approach to 51.7 for ACSH, accompanied by equally large reductions in merging R factors.
Of particular importance for long wavelength data, the quality of the measured anomalous signal from the analytical absorption corrected-data is significantly higher (Figure 4), leading to higher peaks heights in anomalous difference Fourier maps and the ability to phase a structure with less data than necessary for standard empirical absorption corrections.
|
SH |
ACSH |
|||
|
Overall |
High |
Overall |
High |
|
|
Resolution limits (Å) |
78.96 – 3.37 |
3.43 – 3.37 |
78.96 – 3.37 |
3.43 – 3.37 |
|
Completeness |
99.5 |
98.7 |
99.5 |
98.7 |
|
Multiplicity |
26.3 |
11.5 |
26.6 |
11.6 |
|
I/sigma |
30.9 |
17.5 |
51.7 |
29 |
|
Rmerge(I) |
0.129 |
0.162 |
0.08 |
0.1 |
|
Rmeas(I) |
0.131 |
0.17 |
0.082 |
0.105 |
|
Rpim(I) |
0.025 |
0.047 |
0.015 |
0.03 |
|
CC half |
0.996 |
0.989 |
0.998 |
0.996 |
|
Anomalous completeness |
99.8 |
98.4 |
99.8 |
98.4 |
|
Anomalous multiplicity |
15.4 |
6.5 |
15.6 |
6.5 |
|
Anomalous correlation |
0.169 |
-0.034 |
0.268 |
-0.283 |
|
Anomalous slope |
1.46 |
1.877 |
||
|
Total observations |
48454 |
897 |
49003 |
903 |
|
Total unique |
1845 |
78 |
1845 |
78 |
Table 1: Processing statistics for data collected at λ = 5.16 Å on a lysozyme crystal with two absorption corrections methods: SH = spherical harmonics, the standard method applied in DIALS, ACSH = a combination of analytical absorption corrections and spherical harmonics.
Conclusions
Sample absorption for X-ray diffraction data collected at very long wavelengths has a detrimental effect on data quality. Complementing the diffraction experiment with tomography data collection enables an accurate volumetric characterisation of the sample and the calculation of analytical absorption correction factors, leading to a significant boost in the strength of the measurable anomalous signal and the confidence of detecting elements with absorption edges situated at long wavelengths.
References
[1] Wagner, A et al (2016). Acta Cryst. D72, 430
[2] El Omari, K. et al (2024). Acta Cryst. D80.
[3] El Omari, K., et al (2023) Commun Chem 6, 219
[4] Kazantsev, D., et al (2021) J. Synchrotron Rad. 28, 889
[5] Arndt, U. W. (1984) J. Appl. Cryst. 17, 118
[6] Beilsten-Edmands, J., et al (2020) Acta Cryst. D76, 385
[7] Evans, P. R. & Murshudov, G. N. (2013) Acta Cryst. D69, 1204
[8] Lu, Y., et al (2024) J. Appl. Cryst. 57, 649
[9] Lu, Y., et al (2024. J. Appl. Cryst. 57, 1984
[10] Winter, G., et al (2018) Acta Cryst. D74, 85
[11] https://ccp4.github.io/dimple/
You can download the PDF version of this article here.

Diamond Light Source is the UK's national synchrotron science facility, located at the Harwell Science and Innovation Campus in Oxfordshire.
Diamond Light Source Ltd
Diamond House
Harwell Science & Innovation Campus
Didcot
Oxfordshire
OX11 0DE
Copyright © Diamond Light Source. Diamond Light Source® and the Diamond logo are registered trademarks of Diamond Light Source Ltd
Registered in England and Wales at Diamond House, Harwell Science and Innovation Campus, Didcot, Oxfordshire, OX11 0DE, United Kingdom. Company number: 4375679. VAT number: 287 461 957. Economic Operators Registration and Identification (EORI) number: GB287461957003.