X-ray Emission Spectroscopy
X-ray emission spectroscopy (XES) is one of the so-called photon-in/photon-out spectroscopies in which a core electron is excited by an incident x-ray photon and then this excited state decays by emitting an x-ray photon to fill the core hole. The energy of the emitted photon is the energy difference between the involved electronic levels. The analysis of the energy dependence of the emitted photons is the aim of the X-ray emission spectroscopy.
I20-Scanning
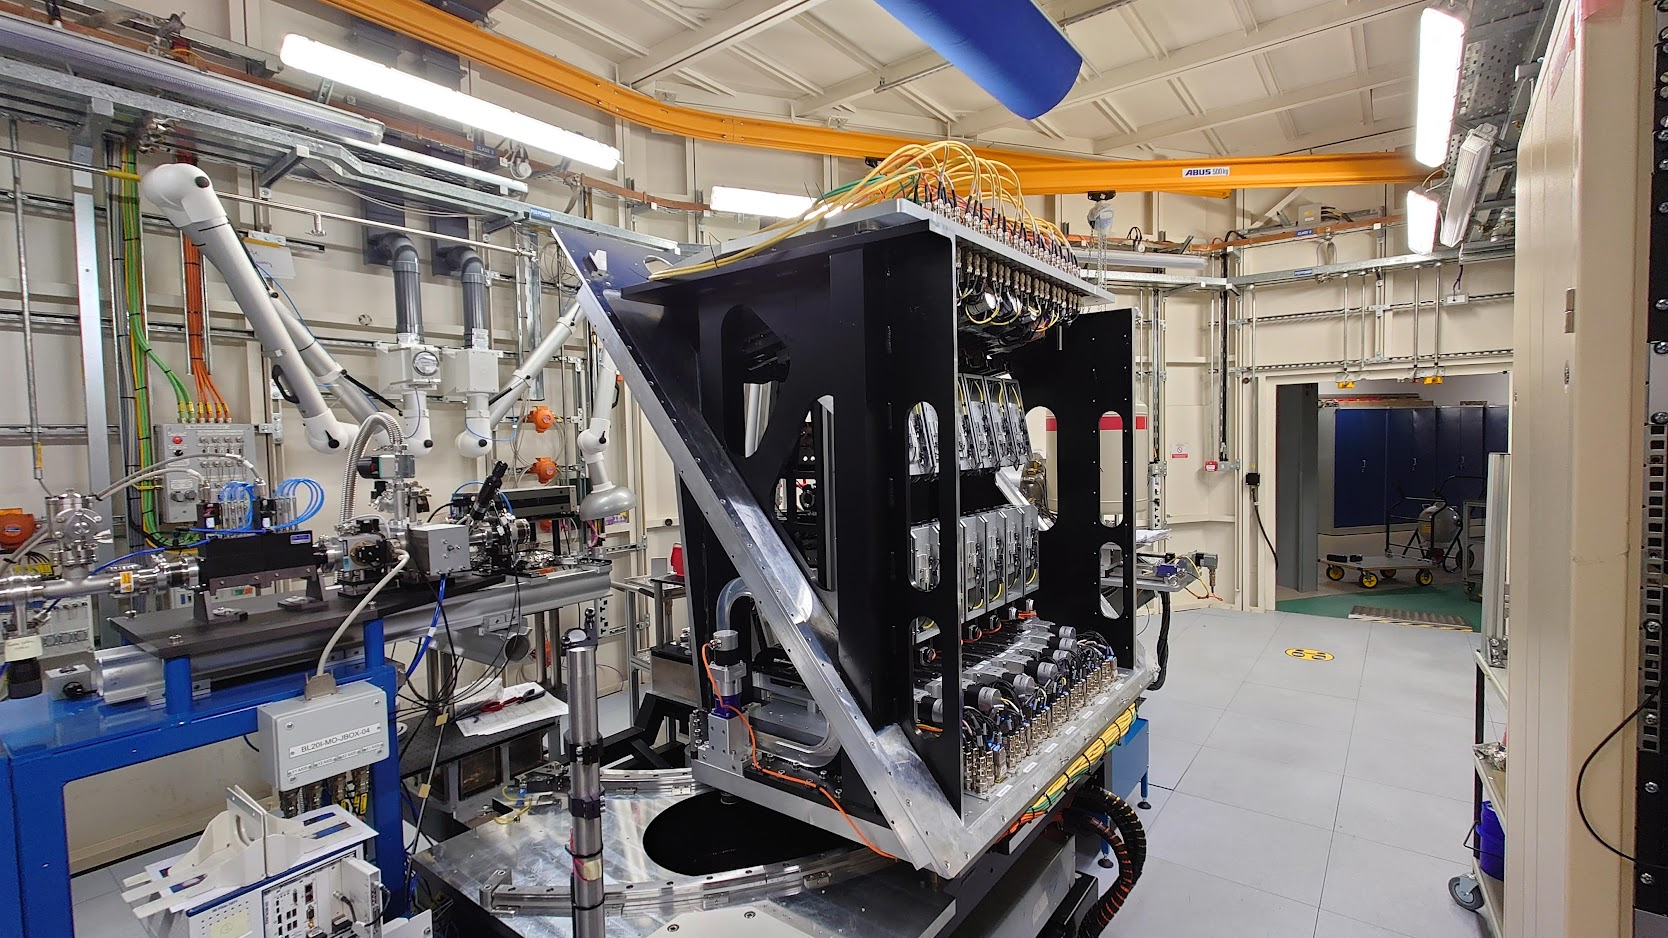
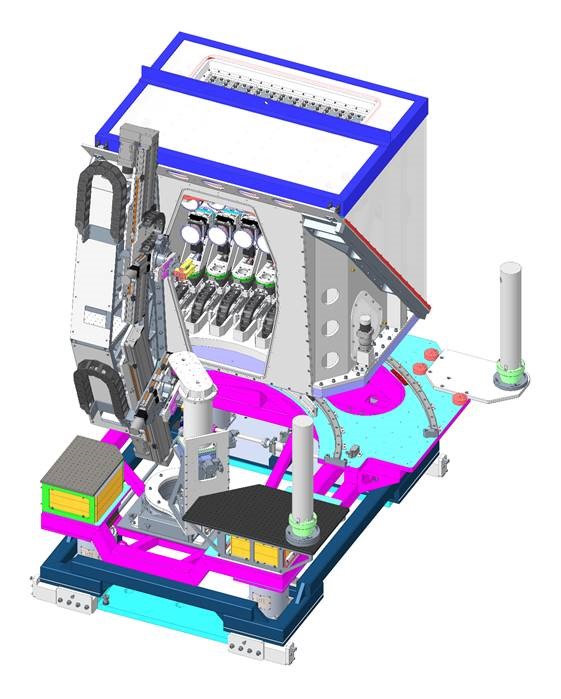
The fourteen-analyser high-resolution hard X-ray emission spectrometer has been operating since 2023. The spectrometer is an in-house designed, Johann-type spectrometer that features 14 spherically bent analyser crystals arranged in two rows. This configuration allows for either high signal-to-noise, single emission line experiments (referred to as 'one-colour') or simultaneous dual emission line experiments (known as 'two-colour').
A list of available analyser crystals and what emission lines they can be used for is available here.
The technical details and capabilities of the spectrometer are published in the following article:
S. Hayama, D. Butler, L. Cahill, J.F.W. Mosselmans, S. Richards, S. Ramos, I. Hall, H. Shorthouse and S. Diaz-Moreno (2026). J. Synchrotron Rad. 33, https://doi.org/10.1107/S1600577526001736

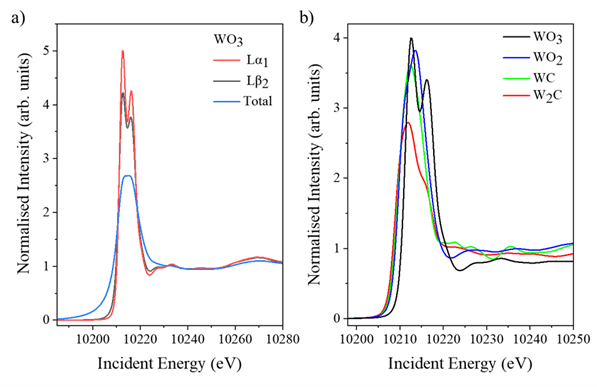
- HERFD-XANES spectra measured from diluted W standard samples. The pellets are mixed with cellulose to minimise self-absorption effects. a) Comparison between Lα1 HERFD, Lβ₂ HERFD and total-fluorescence measured simultaneously from WO3. b) Lα1 HERFD-XANES taken from WO₃, WO₂, WC, and W₂C pellets. All the spectra were normalised to the edge jump.
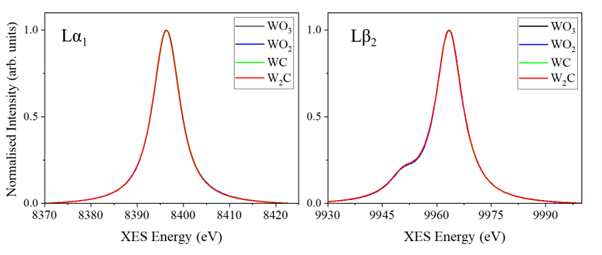
- Normalised Lα1 and Lβ2 spectra measured from WO3, WO2, WC and W2C pellets in two-colour mode.
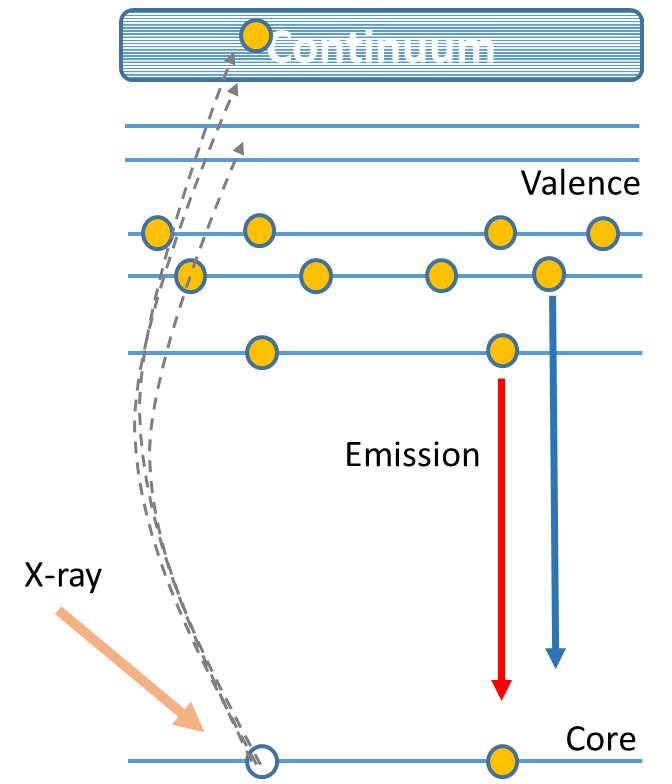
XES is a technique complementary to X-ray absorption spectroscopy (XAS) that provides valuable information with respect to the electronic structure (local charge- and spin-density) as well as the nature of the bound ligands.
In particular, the high-resolution fluorescence detection technique, makes possible to overcome some of the main limitations of conventional XAS. This technique consists of measuring the x-ray absorption spectrum via monitoring the intensity of a fluorescence line corresponding to a specific excited state decay process using a narrow energy resolution. This is generally achieved through the use of a crystal analyzer to select a narrow energy band from the sample’s emission line. By using this technique it is possible to overcome some of the main limitations of conventional X-ray absorption spectroscopy:
- High resolution X-ray absorption spectroscopy. When the absorption spectrum is recorded by measuring the emission line with an energy resolution higher than the natural width of the emission line, the intrinsic resolution is markedly improved.[1] With this technique is then possible to resolve structures which are not visible in a conventional XAS spectrum. This technique has been successfully applied in XANES studies of the LIII edges of elements of the third row transition metals, such as Pt and Au.[2]
- Spin resolved X-ray absorption spectroscopy. Several studies of the Kß emission line of metals have shown a sensitivity to the spin state of the photo-absorbing atoms. The main emission line gives information on one spin state and the satellite emission line on the other. XANES spectra recorded via the emission of the main line or the satellite, are thus spin dependent and recording spin resolved EXAFS becomes a realistic possibility using these methods.[3]
- Site selective X-ray absorption spectroscopy. Differences in the chemical state of photo-absorbing atoms can be seen in the positions and spectral shapes of the emission bands. In a sample where the photo-absorbing atomic species can be found in a range of different oxidation states, high resolution x-ray fluorescence can be used to separate the spectral contributions from the different sites.[4]
- Valence-to-Core emission (v2c) spectroscopy. By measuring the emission lines close to the Fermi energy, the type of ligand can be identified for 3d transition metals.
- X-ray absorption spectroscopy in multi-edge spectral regions in samples where there is an absorption threshold that interferes with data collection in the spectral region of interest, such as in the manganite systems, where the K edge of Mn and the L edge rare earth elements often overlap.[5]
[1] K. Hamalainen, D. P. Siddons, J. B. Hastings, and L. E. Berman, Phys. Rev. Lett., 67, 2850 (1991).
[2] (a) F.M.F de Groot, M. H. Krisch and J. Vogel, Topics in Catalysis, 10, 179 (2000). (b) J. van Bokhoven, C. Louis, J. Miller, M. Tromp, O. Safonova and P. Glatzel, Angewandte Chemie-International Edition, 45, 4651 (2006).
[3] (a) K. Hamalainen, C. C. Kao, B. Hastings, D. P. Siddons, L.E. Berman, V. Stojanoff, S. P. Cramer, Phys. Rev. B, 46, 14274 (1992). (b) Q. Qian, T. A. Tyson, S. Savrassov, C. C. Kao, and M. Croft, Phys. Rev. B, 68, 014429 (2003).
[4] P. Glatzel, L. Jacquamet, U. Bergmann, F.M.F. de Groot, S.P. Cramer, Inorg. Chem., 41, 3121 (2002).
[5] P. Glatzel, F.M.F. de Groot, O. Manoilova, D. Grandjean, B.M. Weckhuysen, U. Bergmann and R. Barrea, Phys. Rev. B, 72, 014117 (2005).