Flavopiridol was discovered to have anti-cancer properties in 19921, specifically by binding to cyclin-dependant kinases (CDKs) and inhibiting ATP binding. Since then it has been involved in a number of phase I and II clinical studies, on its own and in combination with other drugs. Although it binds to specific CDKs with nanomolar affinity, flavopiridol has been given intravenously in higher than expected concentrations to reach a therapeutic concentration at the cancer site. The high concentration required is in contrast to cell-based assays in the lab. The reason for the difference has been suggested to be due to the binding of flavopiridol to plasma proteins in the blood2. Cell based assays use bovine plasma proteins while in clinical trials the drug encounters human plasma proteins. Using circular dichroism (CD) and other biophysical techniques, it has been possible to show the binding affinity of bovine and human serum proteins such as albumin (BSA – bovine serum albumin & HSA – human serum albumin) and alpha-1-acid glycoprotein (AGP), (the major drug binding proteins of human serum) are very similar. The serum proteins do not appear, therefore, to be the cause of the observed clinical differences.

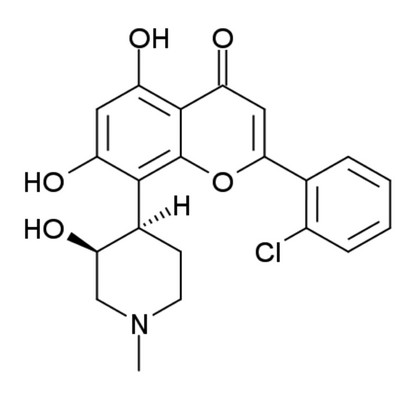
Figure 1: The structure of Flavopiridol (FLAP : (−)-2-(2 Chlorophenyl)-5,7-dihydroxy-8-[(3S,4R)-3-hydroxy-1-methyl-4-piperidinyl]-4H-1-benzopyran-4-one).
Circular dichroism relies on the chirality of molecules to produce a signal. Flavopiridol is chiral (Fig. 1), so has an observable CD signal associated to the free species in solution. The observed signal can change if flavopiridol binds to proteins and can be used to identify bound species in solution.
The first stage in the flavopiridol project was to establish an observable CD change was present when FLAP bound to a protein of interest. Figure 2 gives the results of mixing molar equivalents of FLAP and human serum albumin – fatty acid free (HSAAff).
By examining the difference CD spectrum (Fig. 2 – right - blue trace) we observe a positive diagnostic CD signal at 284nm. After establishing the presence of a signal, a titration was performed to work out the binding affinity and number of binding sites. By plotting the CD at a fixed diagnostic wavelength versus increasing molar equivalents of FLAP binding curves for both HSAAff and bovine serum albumin – fatty acid free (BSAAff) were obtained. Assuming one binding site, the dissociation constant (Kd) can be calculated reflecting the strength of the interactions between the two molecules. The CD titrations are shown in Fig. 3.
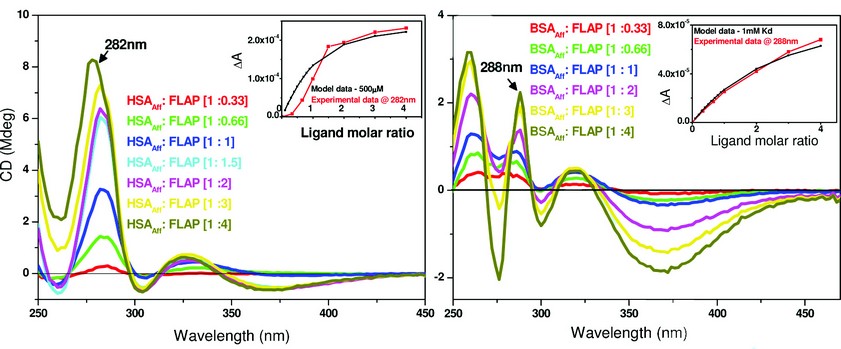
Fig. 3 suggests low affinity binding of FLAP to both HSAAff (Kd ~ 500µM) and BSAAff (Kd ~ 1mM). Further work using competition assays and other biophysical techniques showed that FLAP binds both HSAAff and BSAAff at albumin binding site 1 with a Kd of 20-30µM. It then binds to a number of further sites with a weaker affinity. Figure 3 gives the overall binding affinity of FLAP to the albumin molecule.
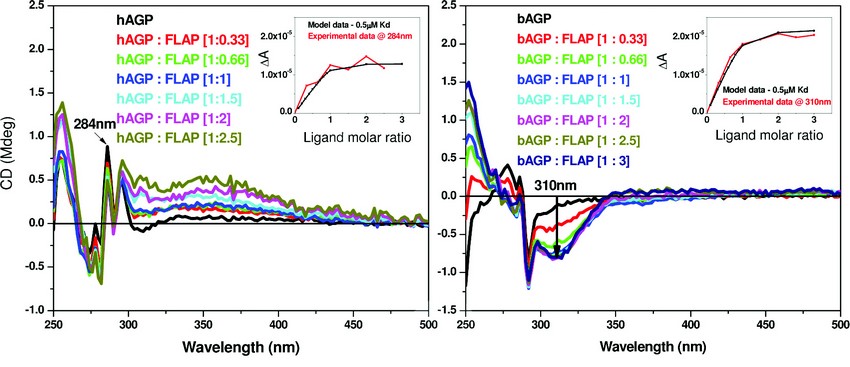
A similar study was then undertaken using human (hAGP) and bovine alpha-1-acid glycoprotein (bAGP). The results of the CD titration are shown in Figure 4. The binding affinity for both hAGP and bAGP using a single binding site model are similar (Kd ~ 0.5µM - see Figure 4. inserts for the respective binding curves). At present we have no evidence for multiple binding sites for FLAP binding AGP.
Figure 2: The CD spectra of the HSAAff : FLAP complex. Left – The CD spectrum of a 3 FLAP : HSAAff complex (red trace) and the combined spectrum of 3 FLAP and HSAAff added (green trace). Right - The difference CD spectrum of the HSAAff : FLAP complex (This is the observed spectrum (Left – red trace) minus its CD components (Left – black trace)). Concentration of HSAAff = 25 μM.

Figure 3: A comparison of the binding affinity of FLAP binding to human (left) or bovine (right) albumin. The difference CD spectra shown were calculated by subtraction of the free FLAP fraction added and the albumin CD spectra from the albumin – FLAP mixture. Inset – shows the binding curves of both taken at a set maximal wavelength. Concentration of HSAAff (Right) and BSAAff (Left) = 500µM. The inserts of both figures show the calculations of the dissociation constant (Kd) that were determined by fitting the plot ΔA intensity at fixed wavelength versus ligand concentration using a nonlinear regression analysis4. The black curves are the simulated fitting for one binding site model with Kd of 500µM (left) and 1mM (right). The red curves are the fittings of the experimental data measured at 282nm for HSAAff: FLAP and 288nm for BSAAff: FLAP mixtures.

Figure 4: A comparison of the binding affinity of FLAP binding to human (left) or bovine (right) AGP. The difference CD spectra shown were calculated by subtraction of the free FLAP fraction added and the AGP CD spectra from the AGP – FLAP mixture. Inset – shows the binding curves of both taken at a set wavelength. Concentration of hAGP = 20μM and bAGP = 10µM. The inserts of both figures show the calculations of the dissociation constant (Kd) that were determined by fitting the plot ΔA intensity at fixed wavelength versus ligand concentration using a nonlinear regression analysis4. The black curves are the simulated fitting for one binding site model with Kd of 0.5μM. The red curves are the fittings of the experimental data measured at 284nm for hAGP: FLAP and 310nm for bAGP: FLAP mixtures
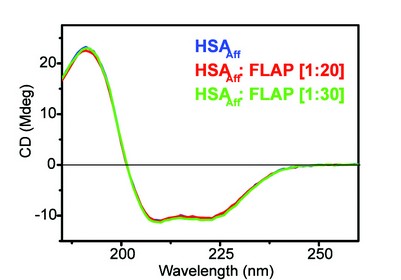
Figure 5: The far-UV CD spectra of HSAAff with increasing molar ratios of FLAP. Concentration of HSAAff = 2 μM.
From Figure 5 it is evident that HSAAff contains a large amount of alpha helical structure, this has been confirmed in the X-ray crystallography model3. As we titrate the drug into the protein we see the spectra still superimpose up to 20 to 30 molar equivalents. This suggests that there is little or no detectable secondary structure change upon titration of FLAP. It is important to note that the pharmacological assessment of drugs is a key stage in drug development. These techniques are essential where crystallisation of the drug : protein complex is not possible, as was the case with FLAP : HSAAff . Using the B23 CD beamline we have shown that human serum albumin and alpha-1-acid glycoprotein are not the main limiting factor in flavopiridol’s activity as an anti-cancer drug. These results indicate that it is not necessary to modify flavopiridol chemically to inhibit its binding properties towards human serum proteins in order to improve flavopiridol’s anti-cancer activity. The search for the reasons why flavopiridol shows poor clinical activity despite its very high pre-clinical activity is still open.
Myatt, D., Johnson, L., Baumli, S. and Siligardi, G. The Binding of Flavopiridol to Blood Serum Albumin. Chirality. Vol. 22 (Issue 1E): E40-43. (2010)
References
- Kaur, G. et al. Growth inhibition with reversible cell cycle arrest of carcinoma cells by flavone L86-8275. J. Natl. Cancer. Inst. 84(22),1736-40 (1992).
- Byrd, J.C. et al. Flavopiridol administered using a pharmacologically derived schedule is associated with marked clinical efficacy in refractory, genetically high-risk chronic lymphocytic leukemia. Blood. 109(2),399-404 (2007)
- He, X.M. & Carter, D.C. Atomic structure and chemistry of human serum albumin. Nature. 358(6383),209-15 (1992). 4 Siligardi, G.& Hussain, R. Application of Circular Dichroism. Encyclopedia of Spectroscopy and Spectrometry, 2nd edition. Vol 1.

