Tools for cancer research and diagnosis: infrared spectroscopy and microscopy
Mar 1, 2013
Mar 1, 2013
Since the middle of the 20th century, infrared (IR) spectroscopy coupled to microscopy has been used as a non destructive, label free, highly sensitive and specific analytical method to reveal molecular structure. Nowadays, synchrotron based IR microspectroscopy offers a signal-to-noise spectral quality unreachable by other broadband sources, and achieves the highest optically attainable IR spatial resolution on microscopic scale samples. This is particularly relevant in Life Sciences, with a significant progression of applications in biomedical research and in particular cancer studies. In view of the validation of the IR fingerprint region as a spectral marker of cancer and anticancer therapy follow up, we have recently performed a set of key experiments on leukemic blasts at the IR beamline B22 ‘MIRIAM’. The results on identification and cross-validation of IR markers of drug actions in the spectra of K562 leukemic blasts are in the following report. The underlining principle of IR spectroscopy is that the molecular structure can be revealed by exciting the vibrational modes in materials. The absorption bands in an IR spectrum are thus a fingerprint of the molecular composition. Within the linear range of Lambert-Beer law, the absorbance is a quantitative measure of the molecular species concentration.
Modern IR spectrometers are based on Fourier Transform (FT) interferometer and they are commonly coupled to all-reflective IR microscopes enabling the acquisition of spatially resolved IR information, for instance, in an individual cell1. When the microscope aperture defining the IR imaging spot at the sample is reduced to 20 μm or less, the photon throughput towards the detector significantly reduces while the detector noise remains constant, thus the signal to noise ratio (S/N) is strongly decreased. Moreover, when working with microbeams approaching in size the wavelength of mid-IR radiation (above 2.5 to 25 μm wavelength), the diffraction limit becomes dominant in the IR spectral interpretation.
By exploiting Synchrotron Radiation (SR) as an IR source, the brightness of the photon flux density reaching the sample is no more a limitation in the illumination of microscopic sample features. High quality spectra of individual cells with a diameter around 15 μm, which is the average diameter of a granulocyte, were obtained at beamline B22. For reference, samples composed of very homogeneous cell populations were measured and usable spectra with acceptable S/R values were achieved with conventional source from larger areas (e.g. 50 μm), which demonstrated the complementarity of microFT-IR with conventional lab instruments.
The IR spectrum of a cell usually contains a large number of absorption bands, many of them can be confidently assigned to the molecular vibrations of a particular group, in particular analysing the ‘fingerprint region’. The unequivocal interpretation of pre-assigned vibrational mode is not straightforward because the common modes of different molecular components within a cell may overlap and the spectrum may reflect only the average biochemical composition. The development of the so-called molecular medicine requires the identification of biomarkers that can be associated to disease-specific molecular pathways. In an attempt to extend the biomedical applications of microFT-IR, we applied mid-IR analysis to search for specific vibrational components with the equivalent significance of a traditional cancer biomarker. That is: a specific gene, or a more or less expressed protein, or protein activity, or as some ‘…omics’ signatures. Specific protein components, for instance BCR/ABL oncoprotein, cannot be directly measured in the spectrum of leukemic cells without some labelling and/or other forms of pre-treatment in samples, and in the absence of a calibration method. Nevertheless, in perturbing cells, with drugs specifically targeting BCR/ABL-associated tyrosine kinase, we were able to identify some spectral components with the potential significance of IR biomarkers exhibiting the downstream effects of specific oncogene activity.
Cells interacting with their environment receive signals that are transduced to the nucleus through a complex array of biochemical signals known as signal transduction processes. These signaling events are specific for the agonist/s but can have some common features, like the activation of phosphorylation/dephosphorylation processes on a specific set of macromolecules. Biochemical, functional, structural and dynamical changes occurring also in complex systems subjected to specific perturbations can be identified by difference spectroscopy2. For instance, during typical time-course or dose-response experiments with drugs, the spectral features from groups that do not change during the stimulation annihilated one another, and only the changes occurring as a consequence of the activation/inhibition become evident in the difference spectrum.
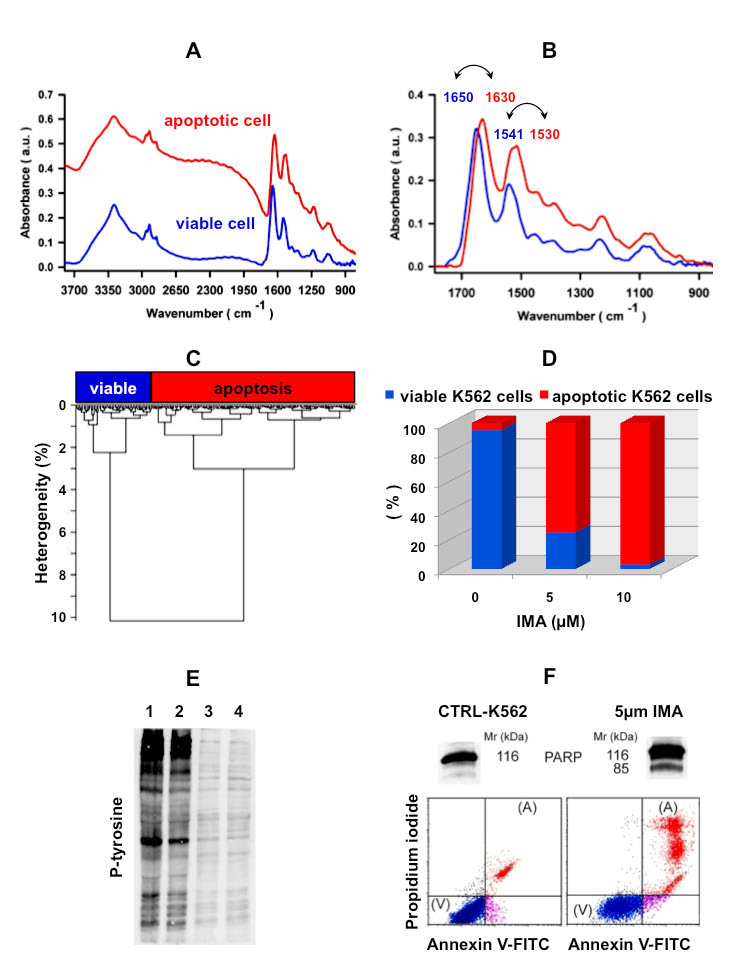 |
| Figure 1: The identification and cross-validation of IR markers of drug actions in the spectra of K562 leukemic blasts. (A) The representative SR FT-IR absorbance spectra of viable (blue trace) and apoptotic (red trace) K562 blast cells exposed for 24 hours to 5 μM imatinib mesylate (IMA) in the interval of wavenumbers between 3800 and 850 cm-1. (B) The same base-line corrected spectra within the interval of wavenumbers 1800 and 850 cm-1 showing the significant shift of amide I and amide II towards (double-edged arrows) in the absorbance spectrum of the cell undergoing apoptosis (red line). (C) The unsupervised recognition of the IR patterns of viable (drug-resistant) and apoptotic (drug-sensitive) K562 cells in samples, respectively. (D) The cumulative fractions of K562 blast cells with viable (blue) and apoptotic (red) IR patterns resulting from a typical dose-response experiment with IMA, respectively. (E) and (F) cross-validation of IR analysis by immunoblotting analysis of phosphorylated proteins. (E) cell lysated of untreated CTRL (lanes 1 and 2) and of K562 cells exposed to 5 μM IMA for 24 hours (lanes 3 and 4) were probed with anti-phosphotyrosine antibodies PY99 and 4G10. (F) The cleaved 85 kDa band of poly(ADP-ribose) polymerase (PARP) is a molecular marker of cell apoptosis. (F) The relative percentages of dead cells determined by flow cytometric analysis in parallel untreated CTRL and IMA-treated K562 samples. (E) and (F) were taken from ref. 4. |
In the attempt to move microFTIR ‘from spectroscopy labs to Hospitals’, we have recently demonstrated with a set of experiments performed at the IR beamline B22 ‘MIRIAM’, that a specific region of mid-IR absorbance spectrum is associated to the reduction in tyrosine phosphorylation levels in human leukemic cell models following treatment with the tyrosine kinase inhibitor (TKI) imatinib-mesylate, the founder of a class of highly effective BCR/ABL inhibitors of clinical efficacy3. Moreover, we have also identified and cross-validated some typical IR signatures of drug action in cells4 as shown in Fig. 1.
To this scope we acquired SR-based microFT-IR spectra of individual leukemic cells exposed to the pro-apoptotic drug imatinib-mesylate (IMA). Typical IR signatures of cell apoptosis were identified by supervised data analysis in the spectra (Fig. 1 (A & B)). Unsupervised cluster analysis was applied to the dataset allowing the classification of the spectra of cells with apoptotic (drug-sensitive) and viable (drug-resistant) IR patterns (Fig. 1 (C)). This application may suggest that a rapid and economic screening platform based on microFT-IR could be implemented for drug screening of compounds targeting phosphorylation processes or to monitor ex vivo in future, with minimal sample treatment, the efficacy of TKI treatment in the individual patient as hypothesised. These qualitative measurements point to a possible application of the technique in clinical trial with patients, where the procedure could be used as a diagnostic tool influencing thereby the treatment of the patients. This could be a step forward for a more efficient and targeted personalised medicine.
Bellisola, G. and Sorio, C. Infrared spectroscopy and microscopy in cancer research and diagnosis. Am J Cancer Res. 2(1), 1–21 (2012)

Diamond Light Source is the UK's national synchrotron science facility, located at the Harwell Science and Innovation Campus in Oxfordshire.
Diamond Light Source Ltd
Diamond House
Harwell Science & Innovation Campus
Didcot
Oxfordshire
OX11 0DE
Copyright © Diamond Light Source. Diamond Light Source® and the Diamond logo are registered trademarks of Diamond Light Source Ltd
Registered in England and Wales at Diamond House, Harwell Science and Innovation Campus, Didcot, Oxfordshire, OX11 0DE, United Kingdom. Company number: 4375679. VAT number: 287 461 957. Economic Operators Registration and Identification (EORI) number: GB287461957003.