The Data Analysis and Scientific Software group work closely with key science, software and computing groups in Diamond, as well as the wider scientific and industry community, to help maximise the information gained from the challenging experiments done at the facility. The nature of the experiments, either in volume of data or speed of the required results, has led the group and our collaborators to develop a suite of open source software tools that are also finding uses in the wider scientific community.
Data Analysis Workbench (DAWN)
Development of DAWN has continued to add new features for general data visualisation (especially mapped data collections) and processing and analysis for specific science fields (including XPDF and PEEM). The release of DAWN 2.0 in spring 2016 also saw a significant update to the software infrastructure, along with new tools to facilitate sharing and developments between scientific programmers.
Mapping Project Visualisation
This year the Data Analysis, Acquisition and Controls groups have started working on a large project to improve the performance and usability of mapping experiments at Diamond. The Data Analysis group have been developing the visualisation and live data processing components of this project, which will be used in both GDA and DAWN.
The visualisation has been designed to allow multiple mapped data collections, taken of different areas, at different spatial resolutions, to be viewed simultaneously. The false colour map images can be used to registered images taken with different techniques, for example visible or electron microscopy images, allowing the data to be overlaid. Points can be selected on the maps to show the underlying data, whether 1D (e.g. XRF spectrum) or 2D (e.g. a diffraction image). Different maps from the same scan can be combined into a false colour RGB image, allowing the locations of multiple components at the same time. This should allow users to extract as much information from the data as possible while at the beamline, helping to guide the experiment, making more efficient use of their visit.
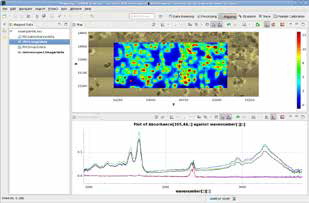
Figure1: Mapping perspective in DAWN, showing overlay of white light microscopy image, false colour absorption map, and absorption spectrum.
X-ray Pair Distribution Function (XPDF)
For the 2D powder diffraction beamlines, new functionality has continued to be added as part of a large cross-beamline project. The most recent addition is the ability to produce an XPDF within the DAWN processing perspective. This has been added by close work between the Data Analysis group and the XPDF beamline (I15-1).
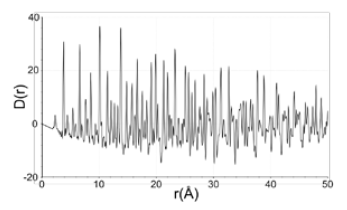
Figure 2: XPDF of CeO2 produced in the DAWN Processing Perspective.
PEEM
Components of DAWN are utilised to produce a bespoke GUI tool for analysing PEEM (photo-emission electron microscopy) images acquired on I06. The PEEMA (PEEM analysis) perspective provides users with tools that enable them to load their data to perform circular dichroism calculation on images acquired with one or two wavelengths. When circularly polarised light at a resonant energy is used, the XAS signal depends on the magnetisation of the probed element along the incident light direction. By calculating the normalised difference of two X-ray magnetic circular dichroism (XMCD) PEEM images with opposite light polarisations, it is possible to probe the magnetic domain structure of the sample. This technique can be refined further by normalising measurements over two X-ray energies or wavelengths: one on, and the other off a resonance peak.
PEEMA comes also with a stitching mechanism that allows users to put together or “stitch” a stack of images (Fig. 3). Each image is a subset of a surface that is scanned taken at different positions. The maximum practical field of view with X-rays is 40μm so stitching the stack of images together allows larger areas to be studied at high-resolution.
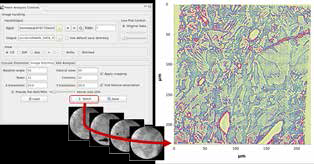
Figure 3: The PEEMA custom view with buttons and fields parameters is used to run the stitching process. In the example, the resulting stitched image of the sample studied shows the magnetic domains in magnetite (Fe3O4) with a particular colour map that outlines features of the surface.
MX automation applied to Chemical Crystallography
Following the upgrade to I19 EH1 the rate of data collection has increased by a factor of five, massively increasing the load on data processing. Since the upgrade the hardware is similar to an MX beamline, however with a more complex diffractometer, making the processing amenable to the existing software on MX. Some development has been necessary to accommodate the more complex geometry and wider range of spacegroups, however the application of xia2/DIALS to processing has been very effective, providing automated analysis within a few minutes. The developers have also ensured that the output is provided in a form suitable for downstream analysis with the existing chemical crystallography software pipeline, allowing the user to progress from the diffraction experiment to the structural information they need in a few minutes (Fig. 4), with very little manual intervention.
In addition to the automated processing, additional “views” on the data, such as the peak locations in reciprocal space drawn from a superposition of all the data rather than a single scan, allow the users to get a clearer idea of the behaviour of the sample in addition to rapid identification of multiple lattices. Finally, a screening tool has been developed to help the users optimise their experiment for the diffracting strength of the sample.
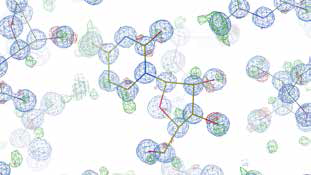
Figure 4: Electron density from Sucrose, data recorded on I19, processed with xia2/DIALS and solved automatically. They hydrogen atoms have not been included in the model at this stage, so the charge for the missing electrons is visible in the map in green.
Tomography
The last year has seen exciting developments in the area of tomography processing in the Data Analysis group. Dedicated effort focusing on the new Savu tomography pipeline, a high-throughput system for high-quality tomographic reconstruction of large datasets, has allowed the software to mature from a conceptual prototype, developed as an investigation into higher quality reconstruction1, to a fully functional implementation currently undergoing testing for release. Core to the development is the design decision to divide the code into two clear sections. The first is the underlying infrastructure responsible for moving the large amounts of tomography data (routinely 100’s of GBs) around, and spreading the task efficiently across multiple computers. The second is the mathematical and scientific side of the work i.e. image processing and novel reconstruction methods. The aim of this separation is for specialists in either field to be able to add to Savu without needing to know about the core, reducing the technical knowledge required and reducing the time needed to implement new features and science.
Savu is being used to help process and interpret multi-modal chemical tomography data collected to investigate catalyst active sites (Fig. 5). Prior to this there was no software for processing large, multi-modal data (over 1,000 GB). The rapid processing and feedback achieved using Savu will make the technique more accessible.
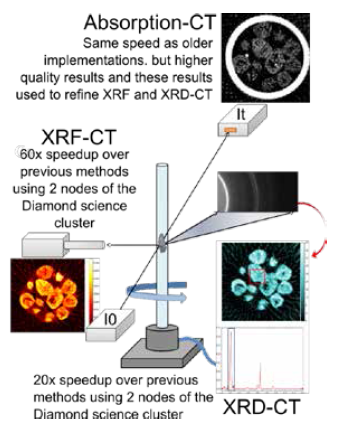
Figure 5: Schematic of a multi-modal scanning tomography experiment and its results.
We have also been working with Nottingham University’s Computer Vision department on accelerating the segmentation of 3D images of cells gathered on Diamond’s B24 Beamline. This process involves classifying the entire cell components in the collected data, and with traditional tools can require weeks of effort per dataset. The HISS package (Hierarchical Interactive Superregion Segmentation) has been developed as part of this collaboration, and is currently being tested on B24. Preliminary findings show that HISS, making use of several new methods2, significantly reduces the time taken to segment the data from weeks to days.
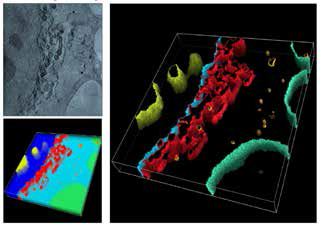
Figure 6: Results from automatically segmented cell images from B24.
References:
- Atwood R.C., Bodey A.J., Price S.W.T., Basham M. and Drakopoulos M. Phil. Trans.R.Soc.A 373: 20140398 (May 2015).
- Luengo I., Basham M. and French A. P. Proc. SPIE 9784, Medical Imaging 2016: Image Processing, 97842D (March 21, 2016).
Acknowledgements
We wish to thank all our collaborators, Diamond beamline staff and users for their continued support and input, especially I06, I15-1, I18, I19, B22 and B24 for help with the example data in this article.

Diamond Light Source is the UK's national synchrotron science facility, located at the Harwell Science and Innovation Campus in Oxfordshire.
Diamond Light Source Ltd
Diamond House
Harwell Science & Innovation Campus
Didcot
Oxfordshire
OX11 0DE
Copyright © Diamond Light Source. Diamond Light Source® and the Diamond logo are registered trademarks of Diamond Light Source Ltd
Registered in England and Wales at Diamond House, Harwell Science and Innovation Campus, Didcot, Oxfordshire, OX11 0DE, United Kingdom. Company number: 4375679. VAT number: 287 461 957. Economic Operators Registration and Identification (EORI) number: GB287461957003.