As Diamond completes its last phase of beamlines our attention turns to building on our investment. Software is key to increasing Diamond’s productivity. It can increase throughput by automating collections and aiding non-expert users, and in some cases by running entirely unattended experiments. Software can also help users run experiments that combine multiple techniques (Fig. 1). As more control is handed to software we will begin asking our beamlines questions rather than telling them what to do. Acquisition like this will depend on analysis software to know what data to collect and when to stop collecting it; and perhaps even to inform what data to keep and what can be thrown away. An interesting side effect will be that we will be capturing and archiving the intent of an experiment along with the data and results. To meet these increasing demands Diamond’s Controls, Analysis and Acquisition groups are improving the way our software fits together, and forming long lived cross-group teams. Diamond’s Mapping Project, described below, is an example of this cooperation.
Diamond’s Data Acquisition group provides the software used by most of our users to drive their experiments. It’s been a busy year for us and the groups we work with, during which we collected nearly 2 petabytes of data. We supported 32 beamlines, eight of which were either in construction, commissioning or planning phases. Across these 32 beamlines, we support around 44 branchlines and end stations, 15 of which are either in construction, commissioning or planning phases. Many of Diamond’s completed beamlines continue to be subject to hardware upgrades and enhancements so that they remain at the forefront of scientific research.
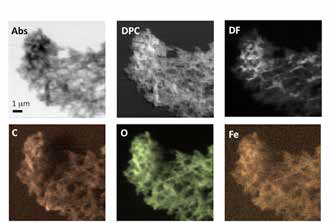
Figure 1: Transmission and fluorescence maps of a particle from Arctic volcano sediments taken on Diamond’s newly commissioned beamline I08. Courtesy L. Benning, U. Leeds and B. Kaulich, T. Araki, M. Abyane, Diamond’s I08.
Data Acquisition Software at Diamond
Experiments at almost all of Diamond’s beamlines are run using our Generic Data Acquisition (GDA) software. This provides a graphical user interface customised for particular scientific techniques or operations (Fig. 2) and a server that is configured to work with the hardware on each beamline. Moritz Hoesch, Principal Beamline Scientist for I05, says:
“The GDA interface for ARPES on beamline I05 proves to be of just the right level of complexity that the users don’t get lost. However the intrinsic flexibility of GDA’s Python scripting allows for the quick implementation of any interesting scan mode or sequence of data acquisitions. The data are saved into a newly defined NeXuS file format. The users find it easy to locate their data in the file and the compression leads to files of moderate size that are transferred easily.”
We have been working to ensure that different beamlines performing similar techniques such as spectroscopy or mapping have as consistent and coherent interfaces as possible. This simplifies the user experience and reduces our development and support costs.
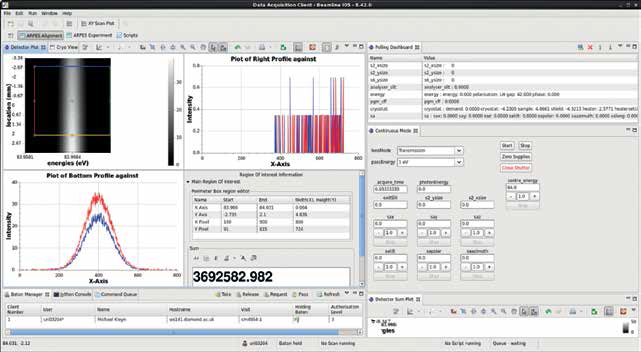
Figure 2: The ARPES perspective used for alignment on I05. Not shown here, this user interface software also includes a perspective for configuring and running basic collections and one for scripting more complex ones.
Ongoing move to NeXus data file format
Diamond is adopting the NeXus file format as our preferred way of recording data and we have been continuing its roll out. NeXus files are selfdescribing binary files with a tree structure agreed by the NeXus community. These files include everything needed to understand the data collection they describe including for example the name and structure of the sample, the geometry of the beamline including the sample stages and the orientation and description of detectors, the exposure time, information gathered during the beamline’s calibration, a description of the scan performed and of course the data itself. Fundamentally, this level of completeness will better preserve the significance of data collected at Diamond and aid its interpretation by both those that took it and by others. More immediately it provides a tidy interface through which to trigger Diamond’s Analysis group’s data reduction pipelines or to analyse and visualise the data after an experiment using Diamond’s DAWN software or with third party tools.
Automated visualisation of single crystal diffraction data
Diamond’s Materials and Magnetism beamline (I16) uses area detectors to collect diffraction data from single crystals. We now record enough information in NeXus files to calculate the orientation of a sample and the position and orientation of each pixel that comprises these detectors. The Analysis group have created a pipeline that combines the data from multiple X-ray diffraction images into very rich 3D representations (Fig. 3). Previously a user would have manually scanned through sections of such shapes to acquire profiles. This is time consuming and sometimes confusing and would never show the degree of detail obtained here. This type of streamlined acquisition and analysis could form the basis for further automation. It is not new, but we are working on making it routine.
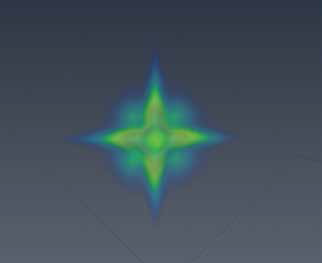 |  |
| Figure 3: 3d representations of a single reflection plotted in a crystal’s reciprocal lattice space. Crystal was a Ge0.896Sn0.104 epilayer fully constrained to Ge buffer (650 nm) on a Si substrate. Taken on I16. | |
Automating our chemical crystallography beamline
Diamond’s I19 beamline has been upgraded with a new detector and sample changer. The Data Acquisition group and particularly the Analysis group have worked hard over the last year to bring MX-style throughput to this chemical crystallography beamline. The beamline now easily collects data five times faster than before the upgrade. To handle this throughput, the Analysis group have adapted software used for determining the structure of macromolecular crystals to work with the smaller, simpler structures investigated on I19. This analysis is now performed automatically (Fig. 4). This type of automation is potentially applicable to many physical science beamlines.
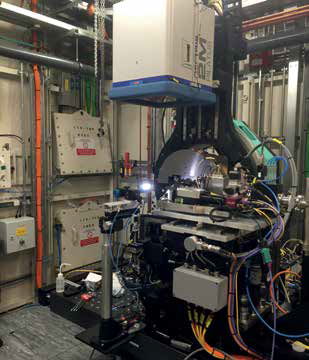 | 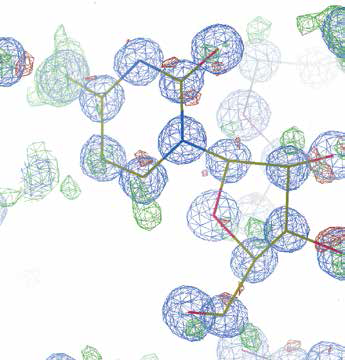 |
| Figure 4: Left: I19's upgraded end station. Right: A structure solved on I19. | |
Diamond’s Mapping Project
Many synchrotron beamlines offer some form of continuous scanning in which data is collected while a sample is in motion. However, this is normally done on an ad-hoc beamline by beamline basis. Diamond has recently embarked on an ambitious project to define how to implement continuous scanning, initially as the standard way of doing virtually all mapping tasks on beamlines. The project is split into four main areas: 1) User interfaces to describe the mapping process in a scientifically relevant way, generating a scan description that can be used later; 2) The physical process of scanning and coordinating hardware motion and detector data capture across the beamline; 3) Capture of the detector data and all the associated meta-data to disk, deciding and describing the layout of the file (or files) for the main use cases; 4) Display and analysis of live data and display of processed data. In order to achieve this common approach across beamlines, the standard software used throughout the facility (Delta Tau motor controllers, EPICS, GDA and DAWN), has been built on.
User interface and experiment work flow
The software will help users interactively explore a sample’s surface by building up and visualising data from a number of scans and microscope images. Each scan might use different techniques, detectors or processing, but all will be visualised in the same framework. Fig. 5 shows an example user interface. In most cases a user will start a session by taking a visual image of the surface of a newly mounted sample. This image will then form the basis for defining regions to scan over.
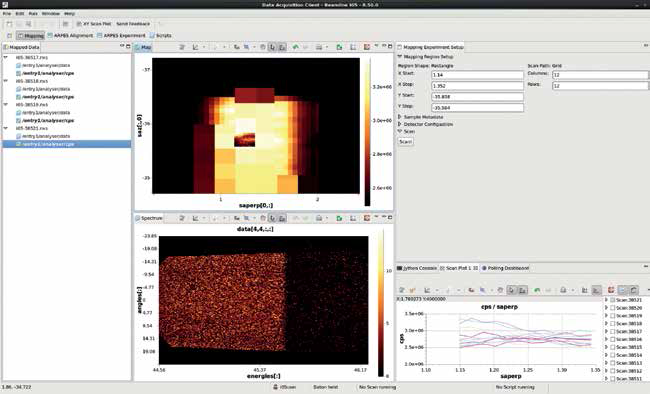
Figure 5: GDA client showing a prototype mapped data view and experiment setup pane on the I05 nanofocus ARPES beamline. The Mapped Data View shows all data which is available for plotting, in this case 4 different resolution maps of the sample. The Map View shows all available maps overlaid, and new regions can be selected for scanning visually in this section. The Spectrum View shows the spectrum or image collected at the selected point on the Map View. Finally, the Mapping Experiment Setup View is an auto-generated view based on the experimental requirements of the beamline.
Standard data flow
To simplify post processing and analysis it is important that the multidimensional, and in some cases multimodal data, along with all the appropriate metadata such as experimental conditions, are stored in a standard format. Diamond uses the NeXus format, described above, backed by HDF5. HDF5 performs very well, especially with the Lustre and GPFS file systems used at Diamond. Unfortunately, HDF5 cannot be read as it is written and so in order to provide live data processing and visualisation separate data paths have been maintained. To simplify this situation, and to solve some other challenges, the HDF group was funded by Diamond, ESRF and Dectris to extend HDF5 to allow access to data as it is written. This extension is known as SWMR which stands for Single Write Multiple Read.
What a user sees as a single NeXus file is in fact a collection of linked files created by processes running across multiple computers (Fig. 6). The Controls group are upgrading their detector and motion control software to write data with the correct shape and path in order to directly form part of a NeXus structure.
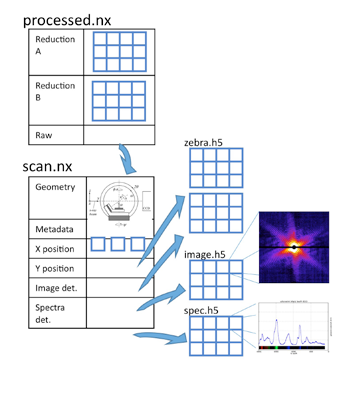
Figure 6: Files resulting from a contrived 4 by 3 map scan. The GDA server crafts a NeXus file which includes a description of the experiment and links to HDF5 files written directly by detectors and motion controllers (provided by Diamond’s Controls group). This linking is invisible to a user of the file. DAWN pipeline software (provided by Diamond’s Analysis group), may then process this data to create a new processed NeXus file linking to the original file created by the GDA software.
The access to live descriptive data SWMR affords greatly streamlined processing and visualisation. The same DAWN software used offline can, with some work, be used online meaning that the Acquisition group need not maintain a separate data path for live processing and visualisation. Further, because data can be read almost anywhere, it can be processed on a computing cluster using a lot of the same software already available for post processing. This will allow sophisticated, and computationally expensive, processing to occur in close to real time. Processed data will also be written with SWMR, providing the visualisation software live access to both processed and raw data.
With all the data available through SWMR, it is possible for processing to be performed by any software supporting this new protocol. However, the DAWN processing system (Fig. 7) will be used (without its GUI) as standard, as it has been used successfully for post processing in many fields such as calibrated powder diffraction imaging and ARPES analysis, integrates with GDA, and can easily be extended to make full use of SWMR.
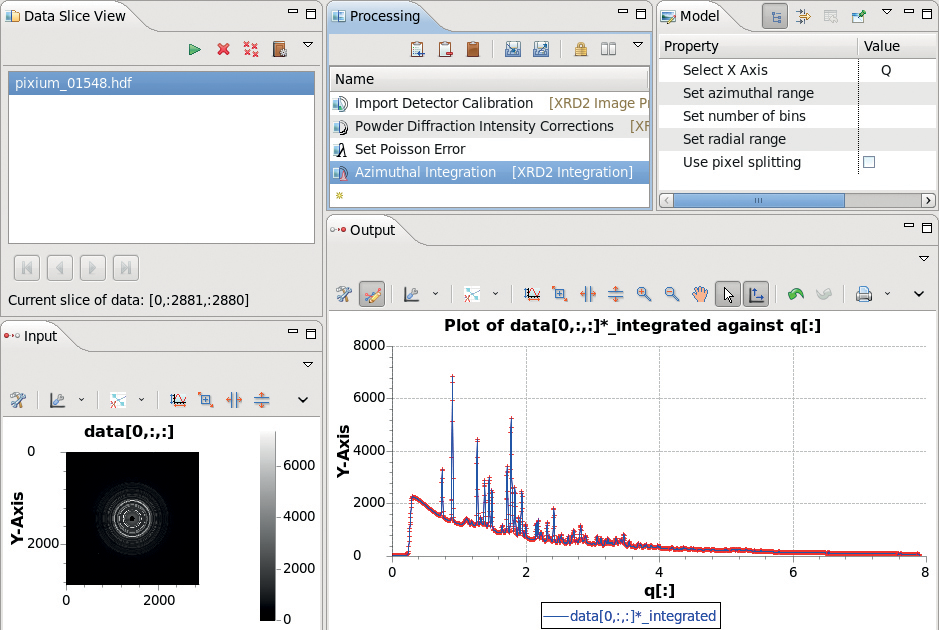
Figure 7: DAWN’s visual UI for configuring processing pipelines that capture calibration data from the acquisition server. With SWMR, once defined offline a pipeline can be run live during an experiment potentially on Diamond’s cluster.
Conclusion
Through working closely, the Controls, Analysis and Acquisition groups are building software that works together to make our beamlines better. As our focus turns towards building on what is in place, we expect software to play a key role in making Diamond’s beamlines more productive. We are speeding up and simplifying the basics, increasing automation and increasingly adding intelligence to our beamlines.

Diamond Light Source is the UK's national synchrotron science facility, located at the Harwell Science and Innovation Campus in Oxfordshire.
Diamond Light Source Ltd
Diamond House
Harwell Science & Innovation Campus
Didcot
Oxfordshire
OX11 0DE
Copyright © Diamond Light Source. Diamond Light Source® and the Diamond logo are registered trademarks of Diamond Light Source Ltd
Registered in England and Wales at Diamond House, Harwell Science and Innovation Campus, Didcot, Oxfordshire, OX11 0DE, United Kingdom. Company number: 4375679. VAT number: 287 461 957. Economic Operators Registration and Identification (EORI) number: GB287461957003.