Kamel El Omari, Ralf Flaig, Dave Hall and Jonathan M. Grimes
Macromolecular crystallography beamlines at Diamond offer the possibility to collect accurate anomalous diffraction data at different energies on high-frame rates and noise-free detectors. These hardware advances have required improvements in both data acquisition software and automated data processing, but also the implementation of data collection strategies to allow users to accurately record their data whilst keeping up with today’s fast data collection.
Protein structure determination by X-ray crystallography requires the estimation of phases, which are lost when measuring X-ray diffraction images. When the protein under investigation is similar to one whose structure is already known, phases can be approximated using the molecular replacement method. Nevertheless de novo structure determination is still a requirement for proteins with no close structural homologues, or for large multimeric protein complexes, where there may be structural data on sub-components.
Nowadays, given the development and availability of synchrotron beamlines with tuneable wavelength capabilities, anomalous diffraction experiments such as single- and multi-wavelength anomalous diffraction (SAD and MAD) are the methods of choice for de novo structure determination. Currently, it has been estimated that more than 70% of all de novo structures are solved by SAD, a technique relying on the measurement of the differences between Bijvoet pairs at a single wavelength1. The development of molecular biology methods to incorporate seleno-methione residues into proteins revolutionised structural biology, allowing the routine and efficient de novo structure determination of proteins by Seleno-methionine MAD/SAD phasing. The technical and methodological developments, particularly in software, stimulated by the take up of Seleno-methionine phasing, also enabled the routine structure determination of proteins that contained metal ions (such as zinc).
Accurate measurement of diffraction data is essential to extract the signal arising from anomalous scatterers, which is usually a few percent of the signal observed in a standard native data collection. The situation is even more problematic for light elements such as sulphurs (Z=16), which produce a signal comparable to noise levels (1-2%). Typically, the quality of the anomalous signal is restricted by radiation damage, crystal quality, diffuse scattering, absorption and measurement errors. The success of phasing depends on how accurately the small difference between Bijvoet pairs can be measured. By using an appropriate data collection strategy it is possible to minimise, for example, the effects of radiation damage by collecting at the same time, or close in time, the Bijvoet pairs.
To allow users to record as accurately as possible the anomalous signal from their protein crystals, two key developments to the data collection protocols have been implemented at the Diamond MX beamlines. Users have the possibility through the GDA data acquisition software to use either the inverse beam data collection method (available on all MX beamlines), or use a mini-kappa goniometer available on I04 and I04-1 beamlines.
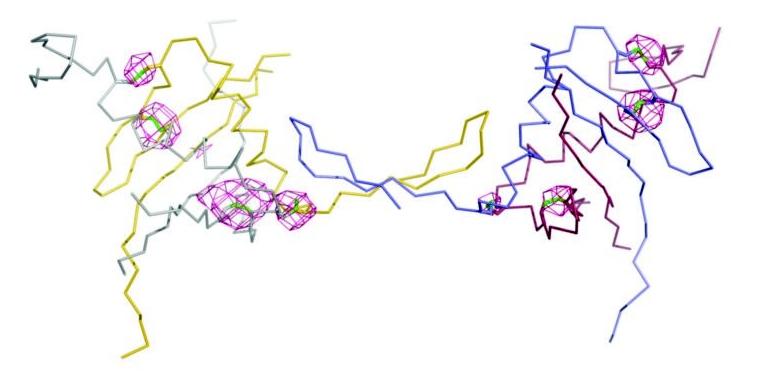
Figure 1: Cartoon of HCV E1 and the anomalous difference map (3 sigma).
The advantage of using an inverse beam SAD data collection, compared to a standard data collection sweep, is that the Bijvoet pairs reflections (h,k,l) and (-h,-k,-l) are recorded very close in time with approximately the same absorption behavior. The idea underpinning this method is that if the crystal is perfectly aligned to the beam, any differences between Freidel mates from diffraction images collected 180° apart, will be due to anomalous scattering rather than differences in absorption or due to radiation damage, and many systematic errors will cancel out. Practically, the method consists in recording small data wedges 180° apart, alternating between φ and φ+180°.
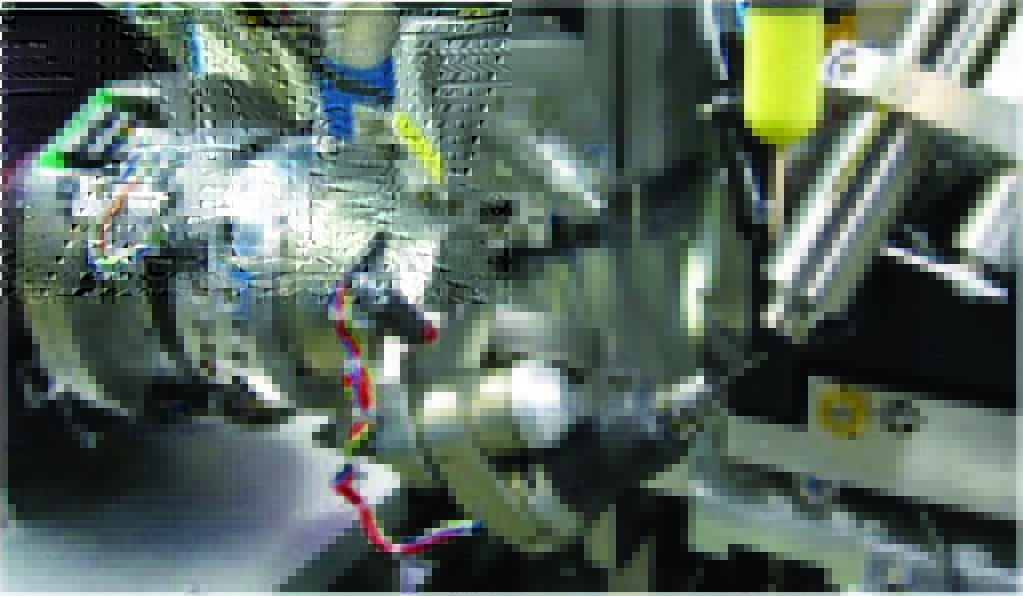
Figure 2: Mini-kappa as mounted on I04.
This method has been recently successfully applied at the I04 beamline for the structure determination by sulphur-SAD phasing of Hepatitis C virus E1 glycoprotein2. Multi-crystal data collection using the inverse beam method was used to improve the signal to noise of the feeble sulphur signal from crystals diffracting to 4.2Å resolution (Fig. 1). The experiment was carefully designed to maximise the anomalous signal; the beam wavelength was tuned to 1.77Å, the crystal lifetime at 1.77Å was assessed by looking at the decay in observed spots (90 seconds exposure) and the beam size matched to the crystal size (80x50 μm). Ninety degrees of data were collected per crystal, as a series of 5° wedges (0.05° per image) with a limited exposure time of 0.05s, using a PILATUS 6M detector in shutterless mode, with a 180° rotation after each wedge3. The data from 32 crystals were merged, and were accurate enough to obtain a substructure solution for 12 disulphides. Real space averaging and phase extension led to interpretable electron density maps for this challenging project which turned out to be the lowest resolution sulphur-SAD structure reported yet2. Pivotal to the success however, was that the crystals of Hepatitis C virus E1 were isomorphous.
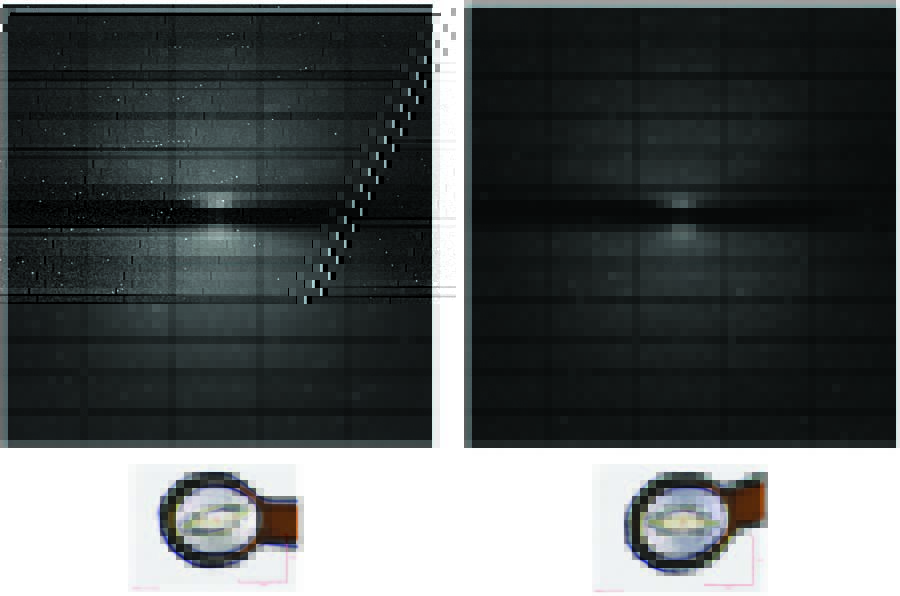
Figure 3: Crystal and diffraction image of HCV E1 before and after reorientation using the mini-kappa.
The second option in the data collection toolkit uses a mini-kappa goniometer head (Fig. 2), which allows the alignment of the crystal so that the Bijvoet pairs can be recorded on the same image, obviating the need of inverse beam data collection, and resulting in more accurately measured anomalous differences, as the reflections are measured simultaneously in dose. This is made possible by aligning a symmetry axis of the crystal with the spindle axis. This method also has the advantage of being faster compared to inverse beam as the goniometer does not need to rotate 180° after each wedge. At the beamline, when a crystal is screened for diffraction, the automatic software pipeline that indexes the diffraction images and calculates data collection strategies using EDNA and Mosflm, will also run XOalign which calculate values for φ and κ that the mini-kappa uses to reorient the crystal. In the current implementation, φ and κ are manually added to the data collection parameters in the GDA and the crystal needs to be realigned prior to data collection. Using the mini-kappa device to collect S-SAD data from the Hepatitis C virus E1 glycoprotein crystals, we have observed an improvement in the signal to noise of anomalous signal (El Omari, unpublished data), although whether this improvement is due solely to the mini-kappa or due to a better matching of the crystal to the beam is unclear.
The routine use of S-SAD phasing is only going to increase in the future, particularly as I23, the bespoke long wavelength beamline, comes online. Going forward and concomitant with the improvements in the experimental set up on the MX beamlines, it is essential to provide users with software to calculate simple to implement strategies that will help optimise their anomalous data collection experiments, particularly in the cases of very weak anomalous signals, when multi-crystal data collection is required to build up the signal to noise. In addition, in the cases where data from crystals need to be merged, sophisticated software needs to be available to help the user make the best possible decisions in what crystals should be used to maximise the anomalous signal. Users who have difficult projects, where crystals diffract weakly or where structure determination is non-trivial, should be encouraged to collect native S-SAD data, since even in cases where it is not key to successful phasing, it can still prove invaluable in aligning the amino acid sequence in low resolutions maps, and in confirming Molecular Replacement Solutions.
References:
1. Hendrickson, W. A. Anomalous Diffraction in Crystallographic Phase Evaluation. Quarterly Reviews of Biophysics 47, (1): 49–93 (2014).
2. EL Omari, K., Lourin, O., Kadlec, J., Sutton, G., Harlos, K., Grimes, J. M., and Stuart, D. I. Unexpected Structure for the N-Terminal Domain of Hepatitis C Virus Envelope Glycoprotein E1. Nature Communications 5: 4874 (2014).
3. EL Omari, K., Lourin, O., Kadlec, J., Fearn, R., Hall, D. R., Harlos, K., Grimes, J. M., and Stuart, D. I. Pushing the Limits of Sulfur SAD Phasing: De Novo Structure Solution of the N-Terminal Domain of the Ectodomain of HCV E1. Acta Crystallographica Section D Biological Crystallography 70, (Pt 8): 2197–2203 (2014).
For more information visit: www.diamond.ac.uk/Mini-Kappa

Diamond Light Source is the UK's national synchrotron science facility, located at the Harwell Science and Innovation Campus in Oxfordshire.
Diamond Light Source Ltd
Diamond House
Harwell Science & Innovation Campus
Didcot
Oxfordshire
OX11 0DE
Copyright © Diamond Light Source. Diamond Light Source® and the Diamond logo are registered trademarks of Diamond Light Source Ltd
Registered in England and Wales at Diamond House, Harwell Science and Innovation Campus, Didcot, Oxfordshire, OX11 0DE, United Kingdom. Company number: 4375679. VAT number: 287 461 957. Economic Operators Registration and Identification (EORI) number: GB287461957003.