
Well, this is it – the final blog post! My summer placement really has flown by and I find myself wishing that I had more time here to get some more data analysis done. Nevertheless, the final few weeks have revealed some interesting things from the Project M data.
As mentioned before, there were some clear signs that some additives have been incorporated into the calcium carbonate structure, as some unit cell dimensions had increased with additive concentration. At the time I’d mainly been focussing on glutamic acid and aspartic acid, and saw this strong trend in each. As I extended my analysis to other additives I also saw a similar trend. It would have just been tempting to stop there and claim this as a result before moving on to other areas of analysis. However, it’s important to quantify trends like this, both in terms of the statistical significance and the actual size of the increase so I spent a lot of time working on both!
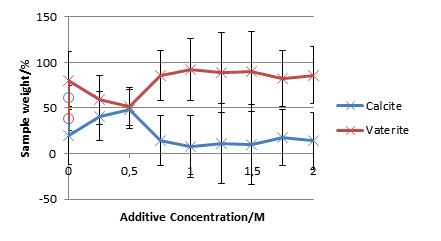
Variations in reactant mixing between schools were most likely to affect the percentage of each polymorph present. The graph above shows that in this case, although the data varied quite a lot between the set of schools involved here, this particular general trend still holds.
Temperature affects the size of the unit cells – atoms have more energy at higher temperatures and move around more, resulting in a larger unit cell. However, this increase is not large. As a general rule of thumb in Project M’s case, if the change in a unit cell axis in a particular school changed by more than 0.1% it was too large to purely be due to a temperature difference in the lab. As you might expect (otherwise it would be a really disappointing blog post) the trends were usually more than 0.1% - usually… Although the trends in schools using the same additive tended to be similar, there was a clear difference between some of the additives. Some led to changes in certain calcite unit cell axis of 0.25-0.35% (massive!) whereas others stayed around the 0.1% mark. This was an exciting find. Why was there this discrepancy between additives?
To answer this question, we need to remind ourselves what the additives are – amino acids! Amino acids are the building blocks of proteins and are all very similar in some respects. They are organic compounds and all contain a carboxyl group (COOH) and an amine (NH2) group. However, they each have their own specific side chain of atoms. These side chains can be grouped into types. For example, there are eight amino acids with hydrophobic side chains, another three have positively charged side chains etc. Could these groups be related to the differences in trend sizes? It turns out that yes they are! The most pronounced unit cell changes occur in those data sets where amino acids with negatively charged side chains were used. Those with polar uncharged side chains caused the next most drastic trends, along with those amino acids with “special case” side chains. This implies that the incorporation of these additives into the crystal structure (discussed in the previous post) may well have something to do with the amino acid side chains.
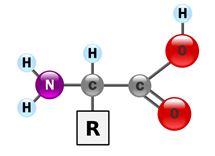
Generic representation of an amino acid. The R group represents the side chain and is what makes each amino acid unique. Image accessed from: https://upload.wikimedia.org/wikipedia/commons/c/ce/AminoAcidball.svg
Of course, it wasn’t just unit cell size that was being investigated. The amount of each polymorph present in the samples was also estimated by Topas, as this gives a good indication of any changes in the stability of each polymorph. It turns out that although the additives with negatively charged side chains packed a punch in terms of calcite unit cell size, they didn’t seem to make a difference the presence/stability of each polymorph. However, the amino acids with polar uncharged side chains, which affected calcite unit cell size a little bit less, did seem to affect stability, with vaterite being predominant over calcite when these amino acids are present in higher concentrations. The first graph in this post is an example of the effect of such an additive!
This is backed-up by the principal component analysis (PCA) mentioned in my previous post. Early indications have shown that there is more vaterite present when the calcite peaks on the diffraction pattern are shifted most (indicating greater change in calcite unit cell dimensions). The incorporation of additives in the calcite unit cell could be making calcite less stable and hence vaterite more predominant…but of course some more PCA and trend analysis will need to be done before saying this for sure and (hopefully) publishing the Project M paper!
So those were the most promising trends that I’ve managed to uncover from the data set during my summer here at Diamond. There potential avenues of research presented by the dataset are endless and I wish I was staying longer to find out what else this data can reveal! I’ve spent some time compiling all the trends I’ve found so that Claire and Julia can chose which ones are best to include in the paper, and prepared the data so that our colleague Jake can continue the PCA to see if there are any more weird and wonderful relationships between variables in the dataset. So watch this space for the paper, and if you participated in Project M see if you can spot your name in the (very special) acknowledgments list!
Other than all the data analysis and compiling, I’ve also spent these last few weeks wrapping up and summarising a lot of what I’ve done. The presentation was fun, albeit in the same way as a rollercoaster – pretty scary, gets scarier the closer you get and then it’s all over in a blur leaving you thinking “ah I actually enjoyed that”. I made a poster too, and managed to win a prize for it so thanks Project M students for giving me some interesting data to talk about! I’m also lucky enough to be writing an article for the Oxford Mail which is really exciting. I’m probably going to write it straight after this so I guess I should also add that an unexpected perk of this placement was the improvement typing stamina.
Hey look it’s a big poser- I mean poster.
The data analysis this summer has been amazing – it’s uncovered lots of new science and probably still has more secrets to reveal. I hope this blog has engaged readers in the scientific process and made you all realise how exciting it can be! Above all I hope that it’s encouraged some of you to pursue a career in science, especially those of you who participated in Project M – you’re already pro chemists having made really high quality calcium carbonate samples to be analysed here at Diamond. So thank you very much for doing such a good job and making this whole project possible! And of course thank you to the most awesome supervisors in the world, Claire and Julia. They’ve made Project M a huge success both in terms of STEM engagement and cutting-edge science, and I couldn’t have asked for better encouragement and guidance this summer.
I’m definitely going to miss Diamond a lot when I leave! As cool as Bath Uni physics department is, it doesn’t quite beat working in a synchrotron. I’ll miss the sights, the constant whirring and sirens going off in the ring, and even that oddly calm automated voice that’s used as part of the fire alarm test every Tuesday. But more than all that I’ll miss the people I worked with and the friends I made here during the summer. Who knows, maybe one day I’ll come back!
Alice

Diamond Light Source is the UK's national synchrotron science facility, located at the Harwell Science and Innovation Campus in Oxfordshire.
Copyright © 2022 Diamond Light Source
Diamond Light Source Ltd
Diamond House
Harwell Science & Innovation Campus
Didcot
Oxfordshire
OX11 0DE
Diamond Light Source® and the Diamond logo are registered trademarks of Diamond Light Source Ltd
Registered in England and Wales at Diamond House, Harwell Science and Innovation Campus, Didcot, Oxfordshire, OX11 0DE, United Kingdom. Company number: 4375679. VAT number: 287 461 957. Economic Operators Registration and Identification (EORI) number: GB287461957003.

 Project M