
Hello again! It’s been a busy few weeks for me at Diamond after first settling in and I’m already over a third of the way through my placement. Time has flown by, which is quite daunting when you have 770 sets of diffraction data to sort through and analyse! Luckily there are plenty of tricks and tools here at Diamond to make swimming through this sea of data a bit easier than it sounds…
The first and most crucial of these is specialist software. I’m using a few software packages to help my analysis. Dawn (Data Analysis WorkbeNch) is a program written by staff in Diamond and I’m pretty sure it can basically do anything – although I’m still looking for the “make a cup of tea” function. Did I mention the free tea and coffee here? The part of Dawn that I’m using takes the data files generated by the Project M diffraction experiment and displays them as a diffraction pattern, plotting intensity against angle. This is the same kind of plot Project M participants will have used to fit peaks in their data to work out what was in their sample. It’s really useful for me because it allows me to plot similar groups of data together, such as those from the same school. I can easily see if the CaCO3 samples made with the addition of an additive are different to those without, and whether the concentration of additive used makes any difference to the sample. So far the results look promising! There definitely seems to be a relationship between the amount of vaterite (a type/polymorph of CaCO3) present in the sample and the amount of certain additives used in its production. It’s really great to have this ocean of data and suddenly see trends and patterns emerging – I think data exploring would be a better name for it.
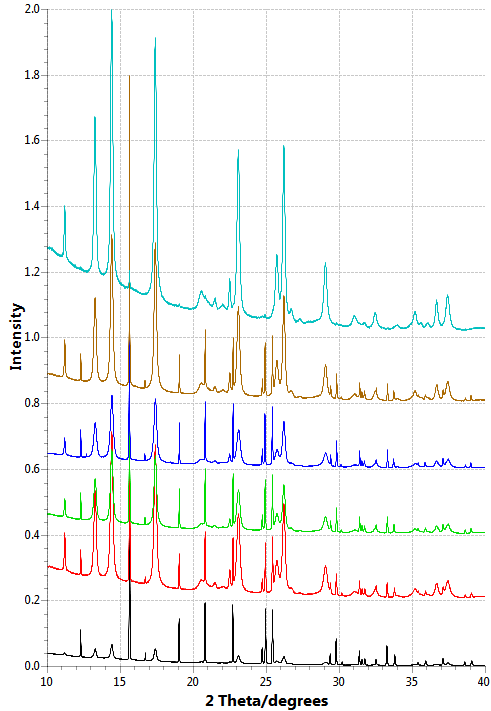
Dawn is really important for visualising the data so I can get an idea of what’s going on before bunging loads of data into a computer and accepting whatever it says. However, a more in-depth analysis of the Project M data would be useful. This is where Topas software comes in. Topas is a mellow kind of character. It looks sleek and simple and very similar to Dawn at first with its intensity versus angle plots. But don’t let it deceive you! It is a genius! Unlike Dawn, Topas takes the real data but tries to “understand” the data for itself by fitting the plot as best it can. This is called refinement, and allows Topas to tell you a lot of things about the sample that are difficult for us humans to work out just by looking at the data. Especially of interest to us in Project M is how much of each polymorph of CaCO3 is present in the samples, and if/how the diffraction peaks differ from sample to sample. Topas can tell us both of these things. It can output the % of each polymorph of CaCO3 present in a sample, and can even look at the shapes of the diffraction peaks and work out whether the size of the repeating patterns that make up the CaCO3 crystals – the unit cells – have changed. A unit cell that’s larger than it should be is a good indication of an additive being incorporated into the unit cell. If this is present in a sample where there is a lot of a particular polymorph, then this could indicate that the additive is making that polymorph more stable. This could help us to understand why ocean creatures are able to make strong, resilient CaCO3 shells and may even help us to make better bone grafts or reduce limescale in our kettles!
The latter may seem a bit random, but one of the many perks of such an extensive experiment, both in terms of participant numbers and geography, is that we can investigate the effects of the wide variety of tap water that we have in the UK. Although small, a quick internet search for “geological map of the UK” paints a vibrant picture of the diversity of the rock we Brits call home. The water we drink flows through these rocks and sometimes picks up ions from them. If you live somewhere with a lot of limestone or chalk then your tap water will contain a lot of magnesium and/or calcium ions - this is known as “hard water”, and you might find it more difficult to make soapy suds and will find limescale (white compounds such as calcium carbonate or magnesium hydroxide) on your taps and in your kettle. We can investigate the effect of these ions on the CaCO3 produced in Project M as each school was asked to make CaCO3 using their tap water (instead of deionised water) and no additive. So far there seems to be a hint that the harder the water the more vaterite is present, but this is a tentative conclusion as I haven’t had a chance to investigate this in many samples yet! More to come on this in future blog posts…
Topas may be clever, but it gets help from its friend Jedit. This is where you input code to tell Topas what you expect to find in the sample so it has a clue where to start with its data-fitting. Mastering Jedit is the key to getting reliable Topas results – I’ve spent a fair bit of time on this so far! Jedit also allows you to program Topas to do batch analysis on lots of files and output certain variables so that you can spot trends. This is very useful in Project M where we have lots of data to sort through.
Although batch analysis is great, there’s still only so much I can do in twelve weeks with all the data! It’s easy to get lost in a big set of data, and having a plan and knowing where to start/what to look for is key for making some initial conclusions. If you participated in Project M, you may recall frustration at some of your milky white CaCO3 precipitate fizzing away and leaving barely anything on the filter paper at the end! This is due to the high acidity of some of the additives (amino acids…clue is in the name) dissolving the freshly-formed CaCO3. Some additives were affected more than others. The silver lining in this dilemma is that it gives me an obvious place to start analysis – on the samples where we have the most successful data sets! The top five additives are glutamic acid, aspartic acid, serine, theronine and histadine; and so these next few weeks will be focussed on finding trends in these data sets.
It hasn’t all been data analysis. I’ve also been cross-checking the worksheets that students filled out when performing the experiments with the masses and temperatures etc. with those inputted on the webpage to make sure we have one correct point of truth for future reference. Any unusual experiment results, such as some precipitates turning blue or pink (this actually happened) can then be checked with the data from that sample to try and explain what’s going on.
I also spent a few days in week two of my placement with local work experience students who came in to Diamond for a week. We followed the Project M worksheets and made our own CaCO3 with various additives. I now have a greater appreciation for all that swirling that everyone had to do and truly understand why some students suggested a more automated approach would be better…

Nevertheless we had fun making lots of samples and did our own diffraction analysis using a diffractometer in one of the labs! We had lots of different calcite and vaterite content in our samples. We also used a UV-spectrometer to shine UV light through a vial where the CaCO3 was being formed to investigate the reaction rate. The mixture turned cloudy as the CaCO3 precipitate was first formed and then as it crystallised and settled the mixture became clearer again. We imaged the samples using a scanning electron microscope (SEM) and saw both calcite (cube) and vaterite (looks like a cauliflower) crystals. The students gave a brilliant presentation at the end – I’m going to have to take tips!

Dissolving a reactant by lots of swirling… Some CaCO3 samples drying overnight in a vacuum chamber. A sight to behold: a fully-loaded capilliary! Lab diffractometer. Analysing reaction rate using a UV spectrometer.
I also had a tour of ISIS, the neutron facility here on the RAL campus with Diamond, with the other summer placement students. It was awesome! If you ever get a chance to come to RAL or Diamond for an open day or tour then make sure you do. They do all sorts of things at ISIS, just like Diamond, but instead of shining x-rays at samples to find out more about them, they bombard them with neutrons. This gives different information than can be obtained from x-ray experiments, as neutrons interact with the nucleus of atoms as opposed to electrons.
As mentioned these next few weeks will be focussed on analysing samples involving those five additives (a meagre 215). I’ve also got some training in a programming language called Python which should be helpful for Jedit!
As always if you have any questions or topics you’d like me to cover in a blog post or video then get in contact via Twitter @DLSProjectM or email [email protected]
Until next time,
Alice

Diamond Light Source is the UK's national synchrotron science facility, located at the Harwell Science and Innovation Campus in Oxfordshire.
Copyright © 2022 Diamond Light Source
Diamond Light Source Ltd
Diamond House
Harwell Science & Innovation Campus
Didcot
Oxfordshire
OX11 0DE
Diamond Light Source® and the Diamond logo are registered trademarks of Diamond Light Source Ltd
Registered in England and Wales at Diamond House, Harwell Science and Innovation Campus, Didcot, Oxfordshire, OX11 0DE, United Kingdom. Company number: 4375679. VAT number: 287 461 957. Economic Operators Registration and Identification (EORI) number: GB287461957003.

 Project M