

 Diamond Annual Review 2016
 | ||
Quantifying bone bridging across longitudinal growth zones in the tibia during healthy and pathological ageing |
Related publication:
Staines KA, Madi K, Mirczuk SM, Parker S, Burleigh A, Poulet B, Hopkinson M, Bodey AJ, Fowkes RC, Farquharson C, Lee PD, Pitsillides AA. Endochondral growth defect and deployment of transient chondrocyte behaviours underlie osteoarthritis onset in a natural murine model. Arthritis & Rheumatology 68, 880-891, doi:10.1002/art.39508 (2016).
Keywords:
Osteoarthritis; Growth plate; Mineralisation; Chondrocyte; STR/Ort.
Osteoarthritis (OA) is a debilitating disease and worldwide healthcare burden. It is characterised by the loss of articular cartilage that normally covers the ends of bones to allow pain free movement. Current clinical strategies only manage the joint pain and do not address the underlying molecular mechanisms that trigger and fuel this degenerative disease. Prior studies have suggested that cells in the articular cartilage undergo uncharacteristic changes, which may result in the deterioration of this tissue. However, little is known of the involvement of a further type of cartilage critical for bone lengthening, known as growth plate cartilage.
Synchrotron X-ray microtomography was performed at Diamond Light Source on the Diamond Manchester Imaging Branchline (I13-2) using 19 keV monochromatic X-rays, to explore the properties of growth plate cartilage in the knees of arthritic mice. The detailed 3 dimensional scanning revealed that this tissue began to close prematurely by forming bony bridges across its length prior to the onset of disease. This bridging was excessive and was more common in areas in which the OA was at its most severe in the aged mouse. The results showed an accelerated growth phenotype in the mice that could contribute to their disease pathology. The clustering of bony bridges found in late OA suggests that their formation is driven by mechanical factors, which gives us an important insight into how this disease progresses.Materials Village | Beamline 113 (Diamond Manchester Imaging Branchline I13-2)
Characterised by articular cartilage loss and underlying subchondral bone thickening, the osteoarthritic joint afflicts much pain and disability. Its underpinning molecular mechanisms are, nevertheless, not fully understood and as such, there is an ever growing need for an effective disease modifying treatment. We know from veterinary studies that canine hip dysplasia, a hereditary predisposition to OA, is more common in larger breeds of dogs which tend to grow more rapidly. Whilst no direct link has been made between growth dynamics and OA, recent murine and human studies have prompted us to speculate that genetic abnormalities and subsequent deformities resulting from altered mechanical loading may contribute to disease onset and progression1,2. Here we combined synchrotron X-ray computed tomography, advanced image processing and computational modelling to investigate whether there is a correlation between the 3D high resolution images of growth plate cartilage topology and OA onset. For this we used a mouse model which natural develops OA, the STR/ort mouse and compared it to its closest available parental strain, the CBA mouse which, in contrast, displays very low spontaneous OA susceptibility.
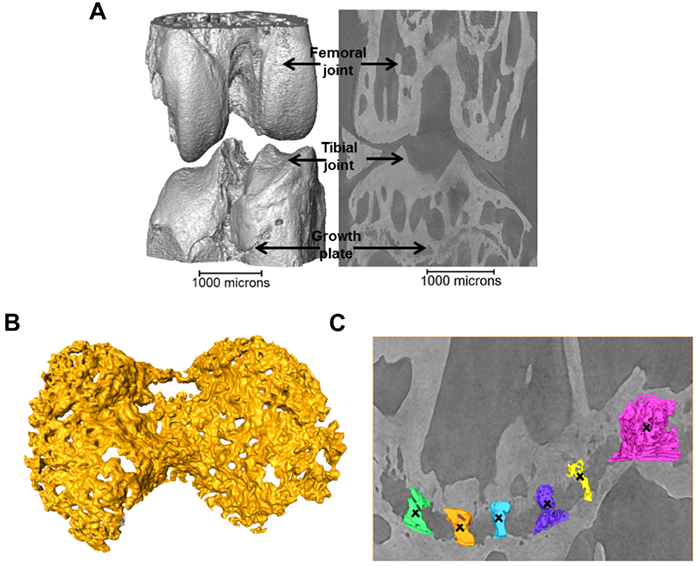
Figure 1: a) 3D representation of the 40+ week STR/Ort joint; b) 3D representation of the growth plate cartilage (yellow) underneath the tibial joint surface (grey, a); c) 3D representation of bridges crossing the growth plate underneath the tibial joint.
Imaging of entire intact knee joints in three dimensions and at high resolution ( ∾3 μm) is of great importance in enabling comparable longitudinal studies of bony bridge formation and building anatomy specific finite element models. The most common investigation techniques are based on optical microscopy, electron microscopy or atomic force microscopy, which variously restrict the exploration volume and rely on damaging sample preparation and serial sectioning. I13-2 can deliver in line phase contrast and high flux monochromatic X-rays over a large field of view, in the 5-35 keV energy range, which is ideal for scanning entire intact joints while producing good contrast.
Images were collected with a 19 keV beam, and exposure time (1s) and number of projection images (1801) were limited to minimise motion artefacts. The specimens were kept fully hydrated before scanning, and sealed with a biofilm during scanning to maintain a moisture balance and avoid beam induced heating and dehydration induced shrinkage3. The projections were collected with 8x magnification (the setup provides 2x magnification in addition to that provided by a 4x magnification lens) by a 500 µm CdWO4 scintillator coupled pco.4000 CCD camera (4008 x 2672 pixels), giving an effective pixel size of 1.1 μm. A filtered back projection algorithm was used to produce 3D volumes from the normalised projections. A typical 3D reconstruction of the joint and 2D slice through the image volume is shown in Fig. 1a revealing the intricate details of the growth plate cartilage (Fig. 1b) and bony bridges (Fig. 1c).
To quantify the bone bridge local number density, a method for projecting them onto the joint surface was developed, similar to techniques used for mapping vascular features4. After projection, the distribution of the areal density of bridges was calculated and superimposed on the tibial joint surface, allowing location and number to be mapped in a single 3D image (Fig. 2). The areal density, d, is defined as the number of bridges per 256 μm x 256 μm window and the histograms presented here were obtained with a class interval size of Δd=1. In parallel, 3D volumetric meshes of the entire tibia including the growth plate cartilage were generated from the tomographic images and finite element computations were carried out to simulate static compressive tests (sustained loading).
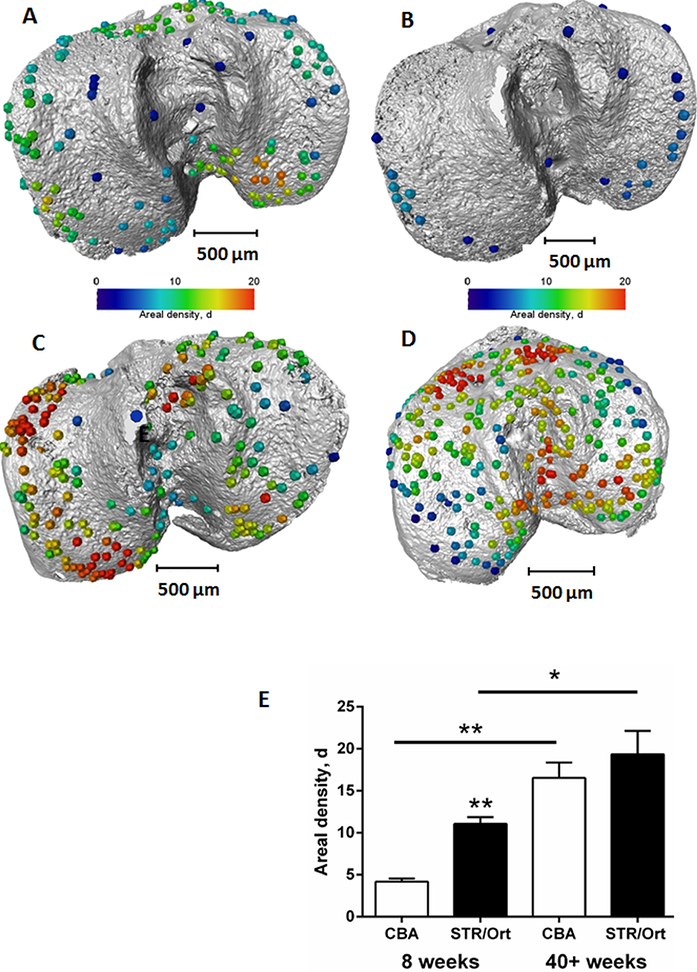
Figure 2: Location and areal density of bridges across the growth plate projected on the tibial joint surface: a) STR/ Ort 8 weeks; b) CBA 8 weeks; c) STR/Ort 40+ weeks; d) CBA 40+ weeks; e) Areal density, d (number of bridges/256 μm x 256 μm window).
This method allowed us to directly test whether longitudinal growth, growth plate fusion and OA exhibit inter relationships in the STR/Ort mice. Applying this novel method to examine growth plate closure in STR/Ort and CBA mice at 8 and 40+ weeks of age revealed a dramatically (10-fold) greater total number of bridges in 8-week-old STR/Ort (137 ± 10) than in CBA mice (14 ± 10; Fig. 2a,b; P<0.001). This enriched growth plate bridging was apparent in all aspects of STR/Ort mouse tibiae. Although still evident in aged STR/Ort mice (40+ weeks), this enriched bone bridging was much more discrete (STR/ Ort: 295 ± 72, CBA: 266 ± 53; Fig. 2c,d). Mean areal bridge densities were also greater in STR/Ort mice at both ages (P<0.01, Fig. 2e). Up to 8 weeks, unlike CBA mice, the bridges in STR/ort mice seem to act as stress concentrators (red dotted lines, Fig. 3a) and hence more likely to fracture under loading and/or to redistribute stresses within these particular vicinities of the growth plate cartilage (Fig. 3).
I13-2 provides an alternative to 2D destructive techniques and a powerful tool for the study of complex biological tissues, allowing us to discriminate osteoarthritic disorders. Our novel method for 3D quantification of bony bridging and our finite element models will no doubt advance understanding of growth plate closure mechanisms. This method has revealed that OA-prone STR/Ort and healthy CBA mice both display overt bone bridges prior to growth cessation. More specifically, spatial localisation of these bridges has shown greater clustering in STR/Ort mice, suggesting that their formation is driven by mechanical loading. The cause of early fusion in STR/ort mice is likely to be driven by genetic abnormalities. Growth strain in these mice may then generate stresses that are contained by the bony bridges, accelerating growth arrest at these vicinities, triggering subsequent joint deformity and cartilage lesions, but this has yet to be explored further.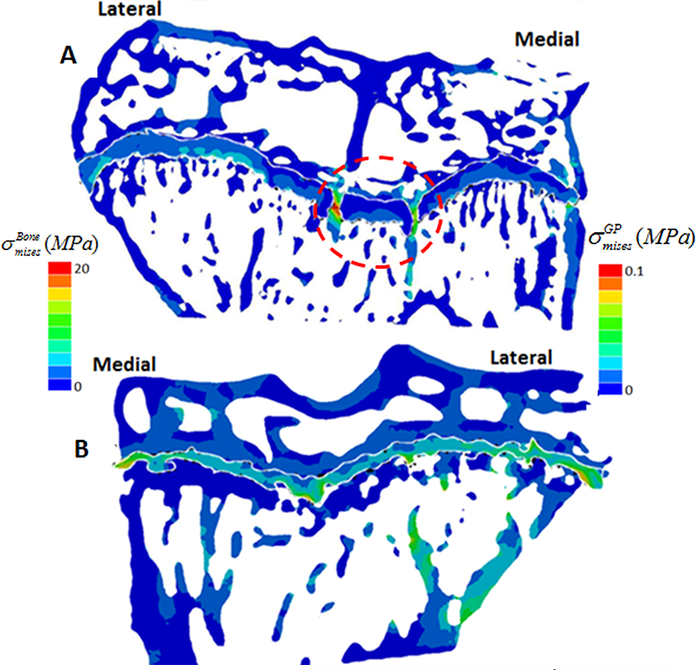
Figure 3: Contour of von Mises equivalent stress (in MPa) in the tibial bone structure at 8 weeks. a) STR/ort; b) CBA.
References:
- Appleton, CT., Pitelka, V., Henry, J. & Beier, F. Global analyses of gene expression in early experimental osteoarthritis. Arthritis & Rheumatology 56, 1854-1868, doi: 10.1371/journal.pone.0032356 (2007)
- Villemure, I. & Stokes, I. A. F. Growth plate mechanics and mechanobiology. A survey of present understanding. Journal of Biomechanics 42, 1793- 1803, doi:10.1016/j.jbiomech.2009.05.021 (2009).
- Pacureanu, A., Langer, M., Boller, E., Tafforeau, P. & Peyrin, F. Nanoscale imaging of the bone cell network with synchrotron X-ray tomography: optimization of acquisition setup. Medical Physics 39, 2229-2238, doi:10.1118/1.3697525 (2012).
- Atwood, R. C., Lee, P. D., Konerding, M. A., Rockett, P. & Mitchell, C. A. Quantitation of Microcomputed Tomography-Imaged Ocular Microvasculature. Microcirculation 17, 59-68, doi:10.1111/j.1549- 8719.2009.00009.x (2010).
Funding acknowledgements:
This work was funded by Arthritis Research UK (18768) and was made possible by the facilities and support provided by the Manchester X-ray Imaging Facility, Diamond Light Source (experiment number: MT5972-3 and MT8665-1) and the Research Complex at Harwell, funded in part by the EPSRC (EP/I02249X/1).
Corresponding authors:
Dr Kamel Madi, University of Manchester, [email protected]; Professor Peter Lee, University of Manchester, [email protected].
