

 Diamond Annual Review 2016
 | ||
How do dislocations shuffle to grow crystals? |
Related publication:
Clark JN, Ihli J, Schenk AS, Kim Y-Y, Kulak AN, Campbell JM, Nisbet G, Meldrum FC, Robinson IK. Three-dimensional imaging of dislocation propagation during crystal growth and dissolution. Nature Materials 14, 780-784, doi:10.1038/nmat4320 (2015).
Keywords:
Bioinspired materials; Imaging techniques; Bragg Coherent Diffraction Imaging.
The question of how dislocations move at the growing facets of a crystal was addressed by Clark et al. at the Materials and Magnetism beamline (I16). The beamline was designed for polarisation analysis of magnetic structures at low temperatures, but was built in a general enough way that other diffraction experiments are possible. Indeed the first coherent diffraction experiments ever performed in the UK took place there during its first year of operation. The only modification needed to the beamline was an extension of the detector arm of the diffractometer to carry a fine-pixel detector to record the intricate fringes due to X-ray interference from the extremities of the micron-sized crystals under investigation. In 2007, the only detectors available were chargecoupled devices (CCDs), but today the Diamond-developed Merlin detector, a counting detector based on the radiation-hard MediPix 3 technology, with its 55-micron pixels, has allowed much better BCDI experiments.
The high spatial coherence of the beam is attributed to the low emittance of the Diamond storage ring and is the same at all its beamlines. However, when I16 was first used for BCDI experiments, there was concern that the beamline optics, notably the focusing mirrors, would spoil the coherence so the beamline was reconfigured to remove it. But later, it was realised that it is only necessary to narrow the slits near the mirror to adjust the coherence length to match the size of the sample1. Since this is a continuous adjustment, it means the beamline can be adapted to provide full coherent flux (as limited by the horizontal emittance) to a useful range of sample sizes. In the experiments on I16, crystals up to 3 μm in size were measured and imaged by BCDI, using support-based phasing algorithms2 to solve the phase problem.
Typical BCDI data collected with the Merlin detector are shown in Fig. 1a. A classical interference fringe pattern can be seen, which results from the wellformed facets of the crystal. The data are clearly oversampled on the detector, as required for the phasing calculation2, since there are several pixels visible within each fringe. The full 3D data set contained 101 such frames spanning the entire width of the rocking curve in angle steps of 0.003°. This 3D volume of reciprocal space is the complete Fourier transform of the imaged volume of the crystal, following an appropriate coordinate transformation.
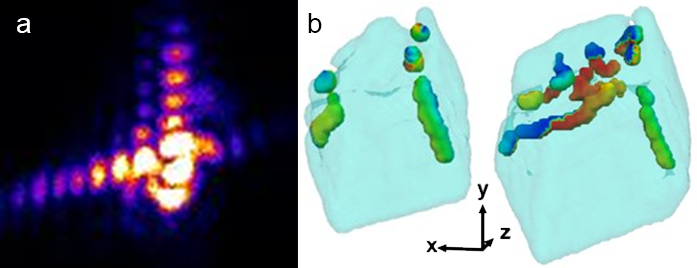 Figure 1: a) Example of a calcite diffraction pattern measured at one of the {104} Bragg peaks. The fringes result from coherent interference from opposite sides if the crystal and the strong asymmetry results from the presence of strain; b) BCDI images of a calcite crystal at two stages of growth from solution. Note the increase in size of the crystal from 1.5 μm to 2.5 μm and that the highlighted dislocations migrate with its growing outer surface.
Figure 1b shows a translucent blue isosurface view of the crystal shape measured at two stages of crystal growth. Some of the crystal facets are flat while the facet pointing towards the top of the page is clearly rougher. Between the two times, this rough facet is found to grow faster than the flatter ones. Also shown superimposed on the picture is a network of dislocations, identified by the nodal line of low density passing down their core. The dislocations have been highlighted as isosurface tubes and coloured according to the image phase, which is identified with the projection of the local lattice displacement along the diffraction Q-vector. The colour scale, running from blue to red, corresponds to a 2π phase change or a displacement of one lattice spacing. Even though the overall image resolution is only around 30 nm, the phase measurement is very sensitive to displacements, i.e. strains, on the picometre scale. Most of the dislocations are congregated on the rapidly growing top surface of the crystal, suggesting they play a role in the material transport processes associated with crystal growth.
Figure 2a shows an enlarged view of three of these dislocations where the phase is seen to rotate uniformly around the surface of the illustrative tube. Fig. 2b shows typical extracted values of the displacement of the lattice measured at three locations, are shown as a function of azimuthal angle measured around the dislocation core, identified by the nodal line in the image amplitude. The trend is clearly linear, in agreement with the simple elastic theory of the structure of a screw dislocation3, shown as the black fitting curve in Fig. 2b.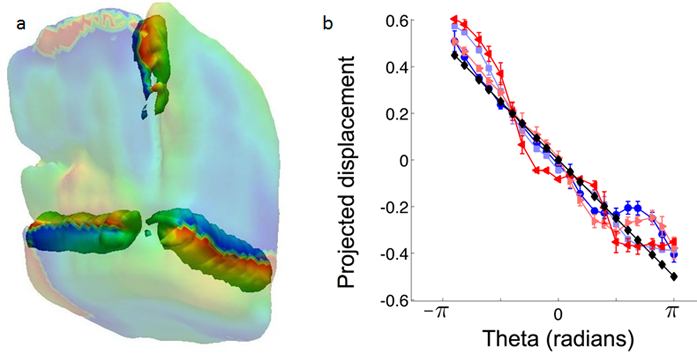
Figure 2: a) Corner view of a calcite crystal with three screw dislocations highlighted by isosurfaces drawn surrounding their nodal lines. The surfaces of these tubes are coloured with the BCDI phase, which varies by 2π around the loop, corresponding to a net displacement of one lattice constrant. The phase scale runs from –π (blue) to +π (red); b) Comparison of the experimentally observed displacement as a function of azimuthal angle around three examples of dislocations in comparison with the theoretical dependence (black) of the projected displacement for an ideal screw in an isotropic medium3.
References:
- Robinson, I. K. Optimisation of Coherent X-ray Diffraction Imaging at Ultrabright Synchrotron Sources. Zeitschrift fur Kristallographie Suppl 27 27-35, doi:10.1524/zksu.2008.0005 (2008).
- Fienup, J. R. Phase retrieval algorithms - a comparison. Applied Optics 21, 2758-2769, doi:10.1364/AO.21.002758 (1982).
- Hirth, J. P. & Lothe, J. Theory of Dislocations. McGraw-Hill: New York, USA (1968).
Funding acknowledgements:
ERC Advanced Grant 227711 “Exploration of strains in synthetic nanocrystals”, EPSRC Leadership Fellowship and a Volkswagen Fellowship. EPSRC Programme Grant EP/I001514/1 and EPSRC grants EP/I022562/1, EP/J018589/1, and EP/K006304/1.
Corresponding author:
Professor Ian Robinson, University College London; Research Complex at Harwell; Tongji University, i.robinson@ucl.ac.uk.
